
Monetary Reset Series : 13/07/2026
Gold & Silver Weekly Update. Most Comprehensive Cross-Asset Positioning & Structural Analysis. Options Flow, Open Interest, COT, Central Bank Reserves, and Macro Cross-Checks.

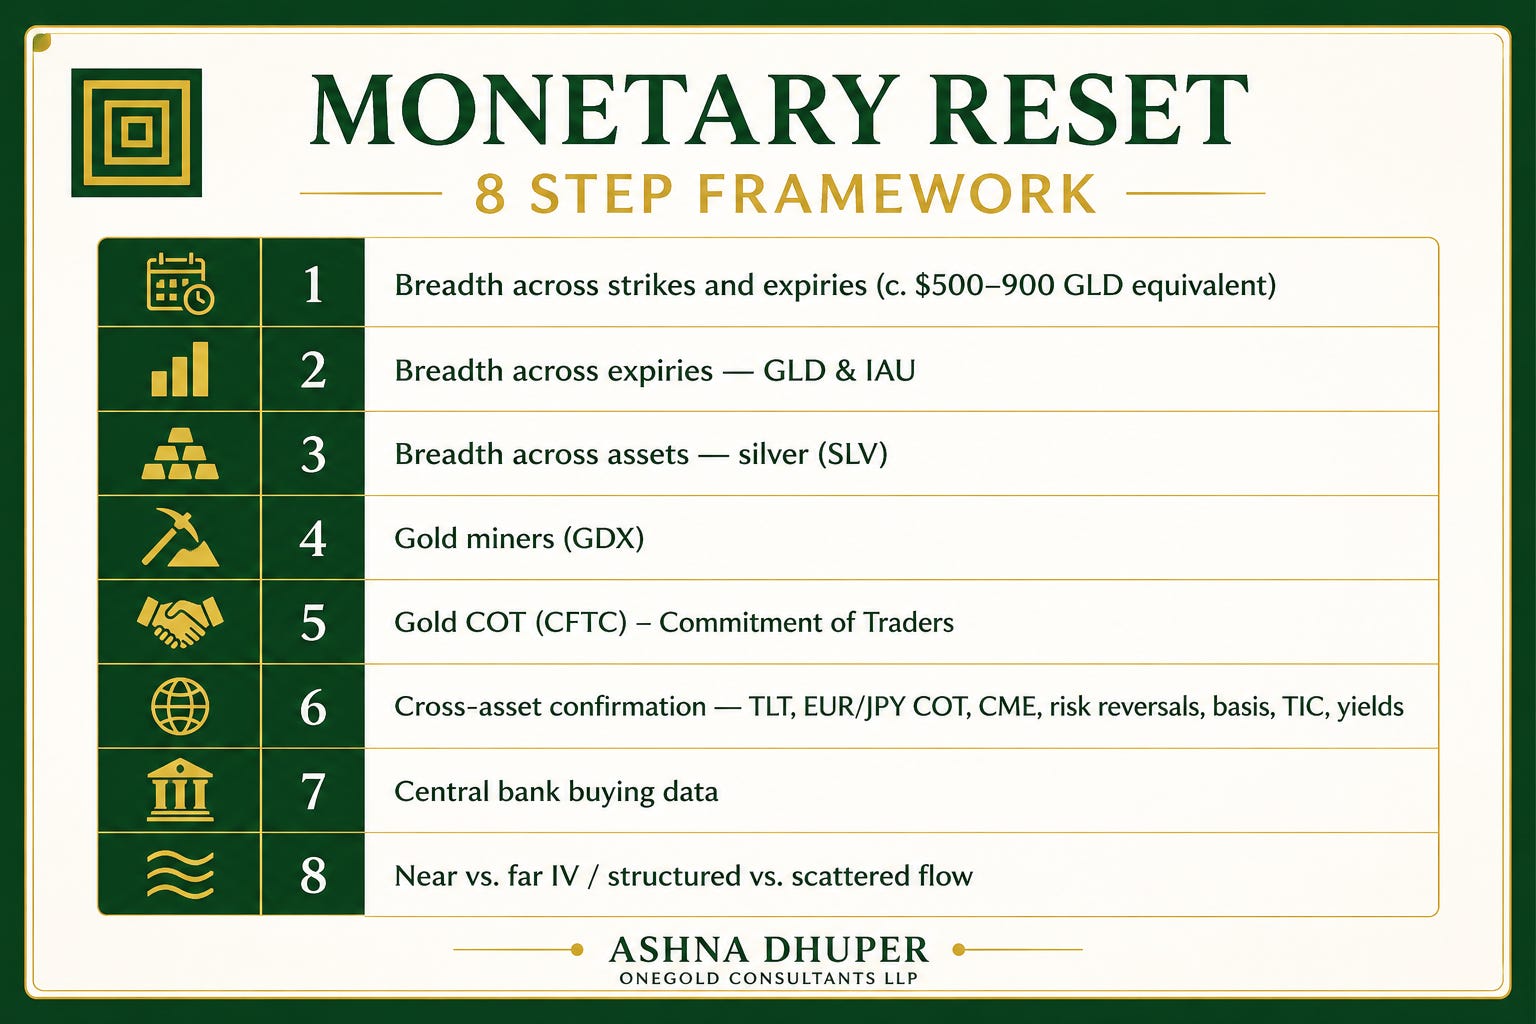
Before diving in, I want to thank everyone for the overwhelming appreciation and support for my previous article, “Gold’s Perfect Storm: The Case for a $10,000 Revaluation.” The response from investors globally, fund managers and fellow market participants was incredibly encouraging.
This piece builds on that foundation. Rather than revisiting the core revaluation thesis, it explores the signals emerging from options markets, central bank activity and global financial infrastructure that may help us understand how institutions are positioning around that possibility. In many ways, this is an extension of the same conversation moving from the why of a potential monetary reset to the how and when markets may begin to price it.
Let’s start with Weekly Update on Gold and Silver
The precious metals market enters one of the most important macro weeks of the year as weakening growth collides with persistent inflation concerns. June payroll growth slowed to just 57,000 jobs, while April and May were revised lower by a combined 74,000 jobs. More importantly, unemployment improved for the wrong reason: labor force participation fell to 61.5%, its lowest level since 2021, indicating workers leaving the workforce rather than stronger hiring. Under the previous Fed framework, such data would have pushed markets toward pricing cuts. However, under Chair Kevin Warsh, whose communication and first dot plot have leaned decisively hawkish, markets continue to focus on inflation persistence rather than labor market deterioration.
As a result, this week’s CPI release becomes the key macro catalyst. Markets are currently pricing a meaningful probability that inflation remains firm enough to justify restrictive policy into the July FOMC meeting. At the same time, Warsh’s preference for trimmed inflation measures that remove extreme price movements introduces the possibility that inflation eventually appears softer than headline CPI suggests. Combined with weakening labor conditions, such a shift could trigger a rapid repricing toward easier policy expectations later in the year.
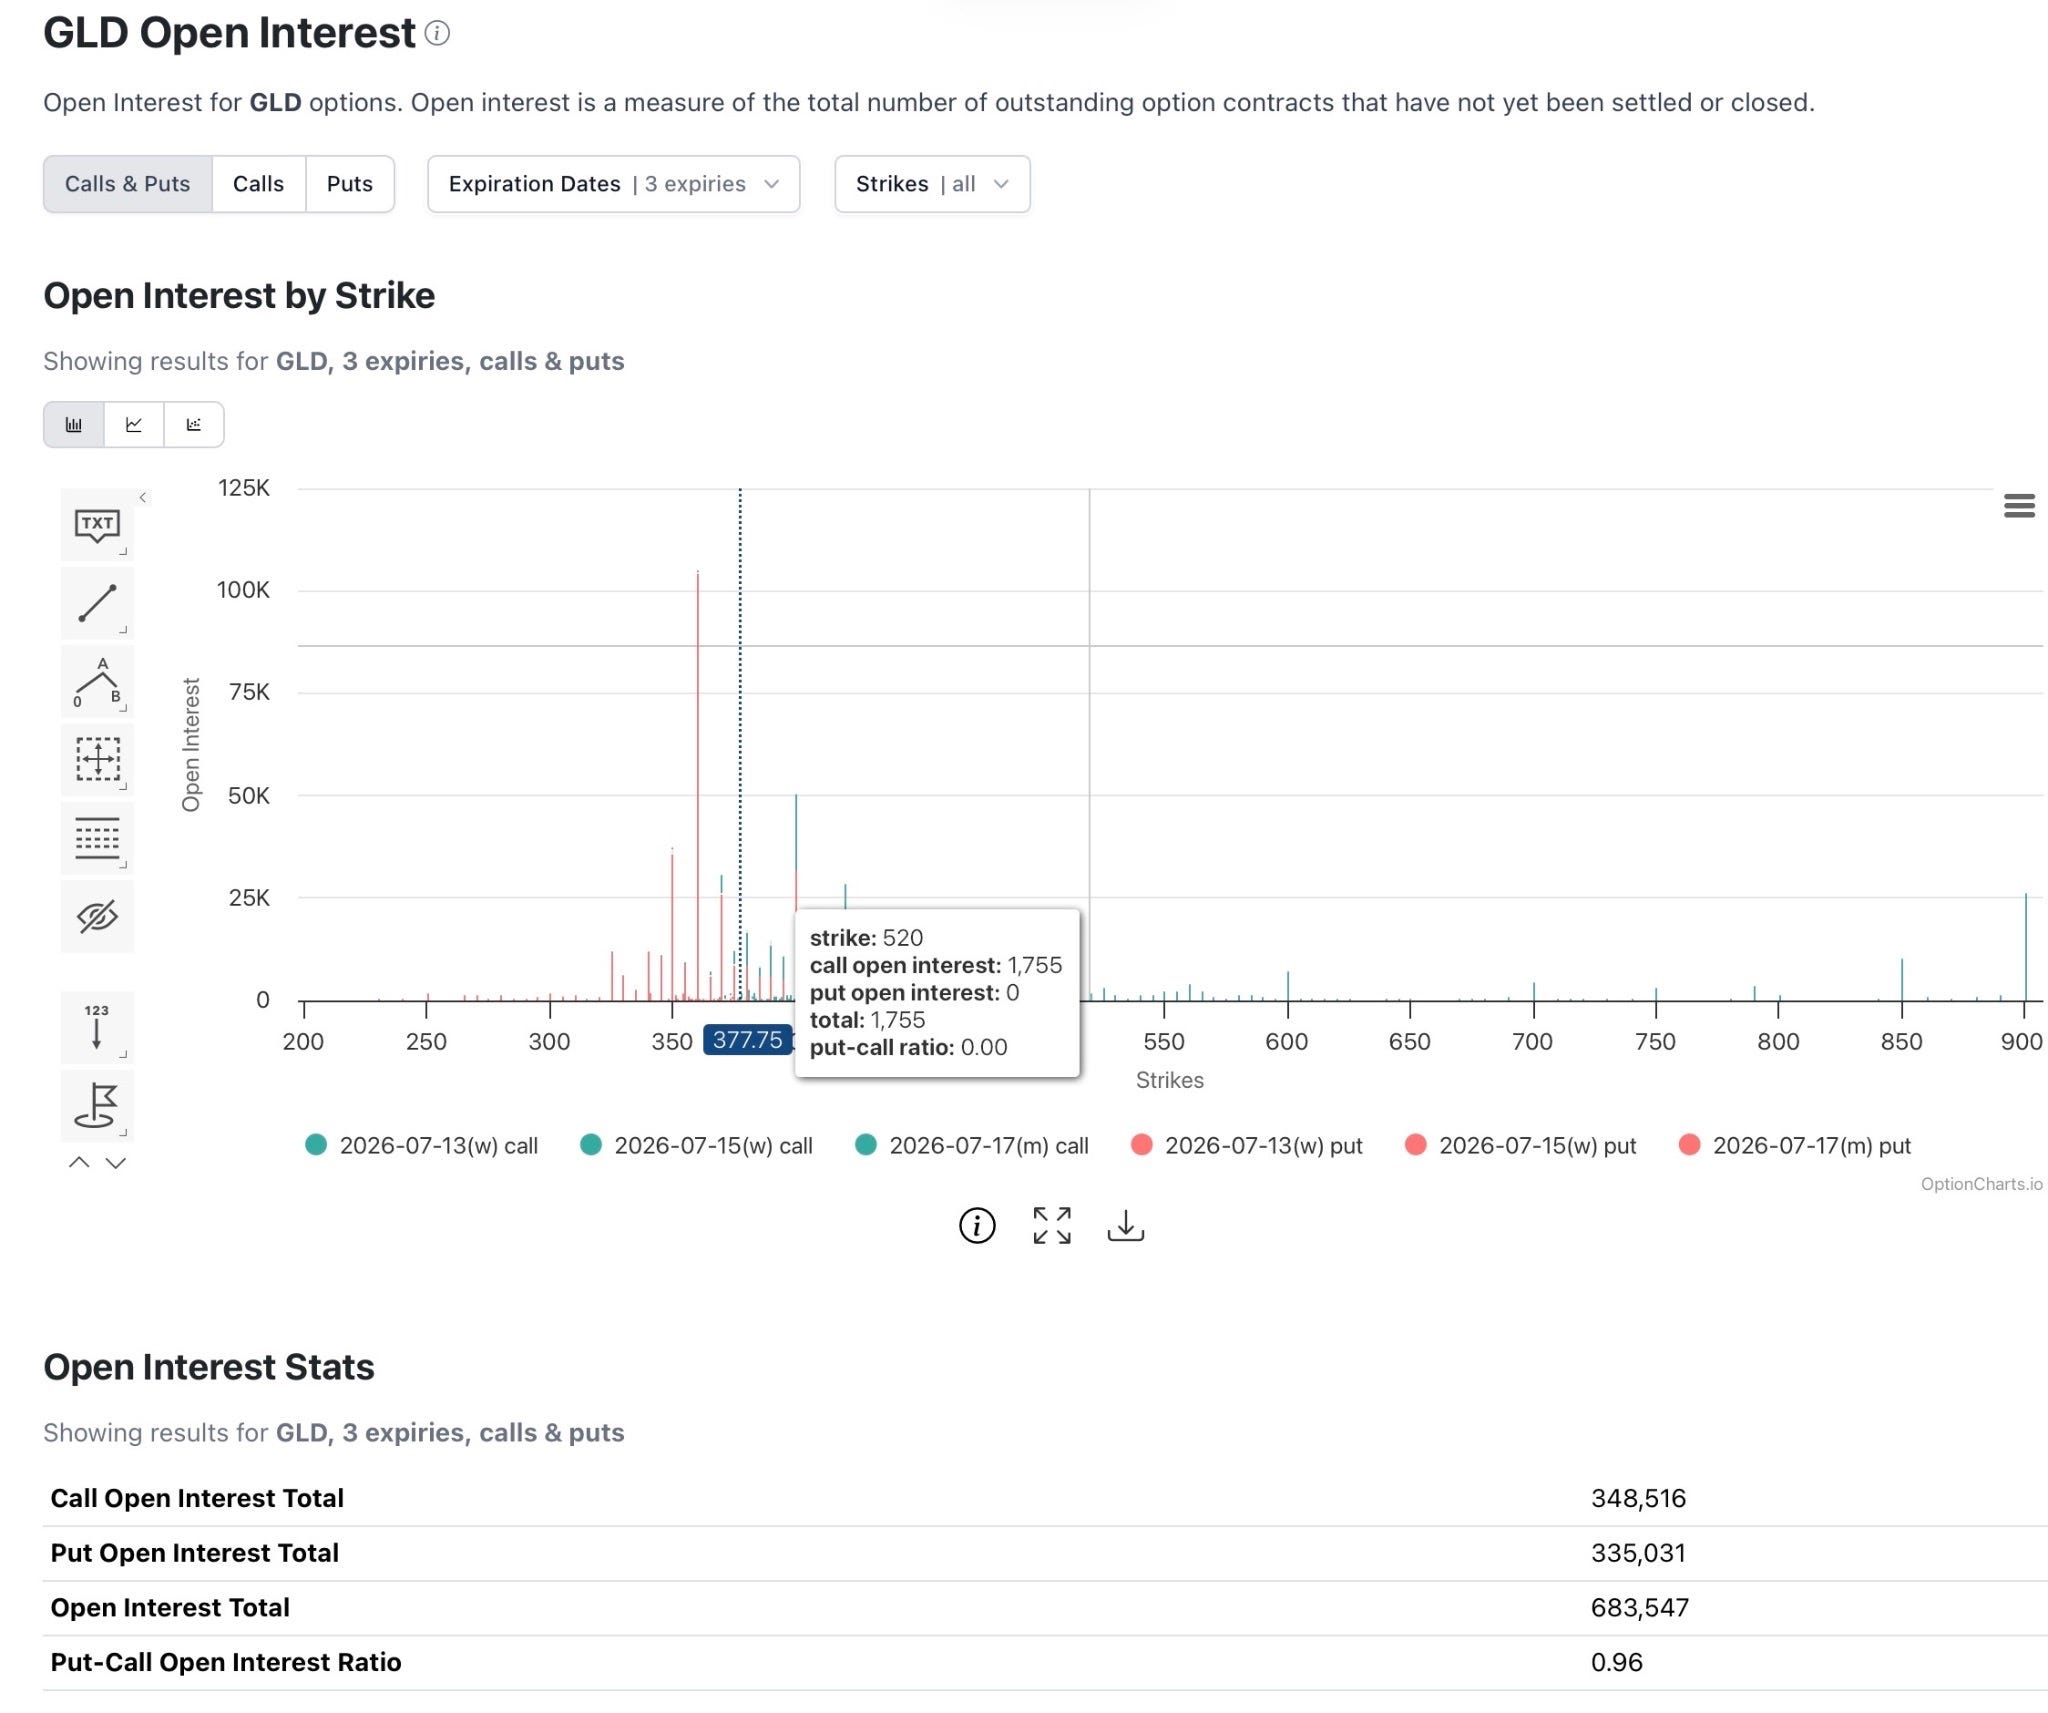
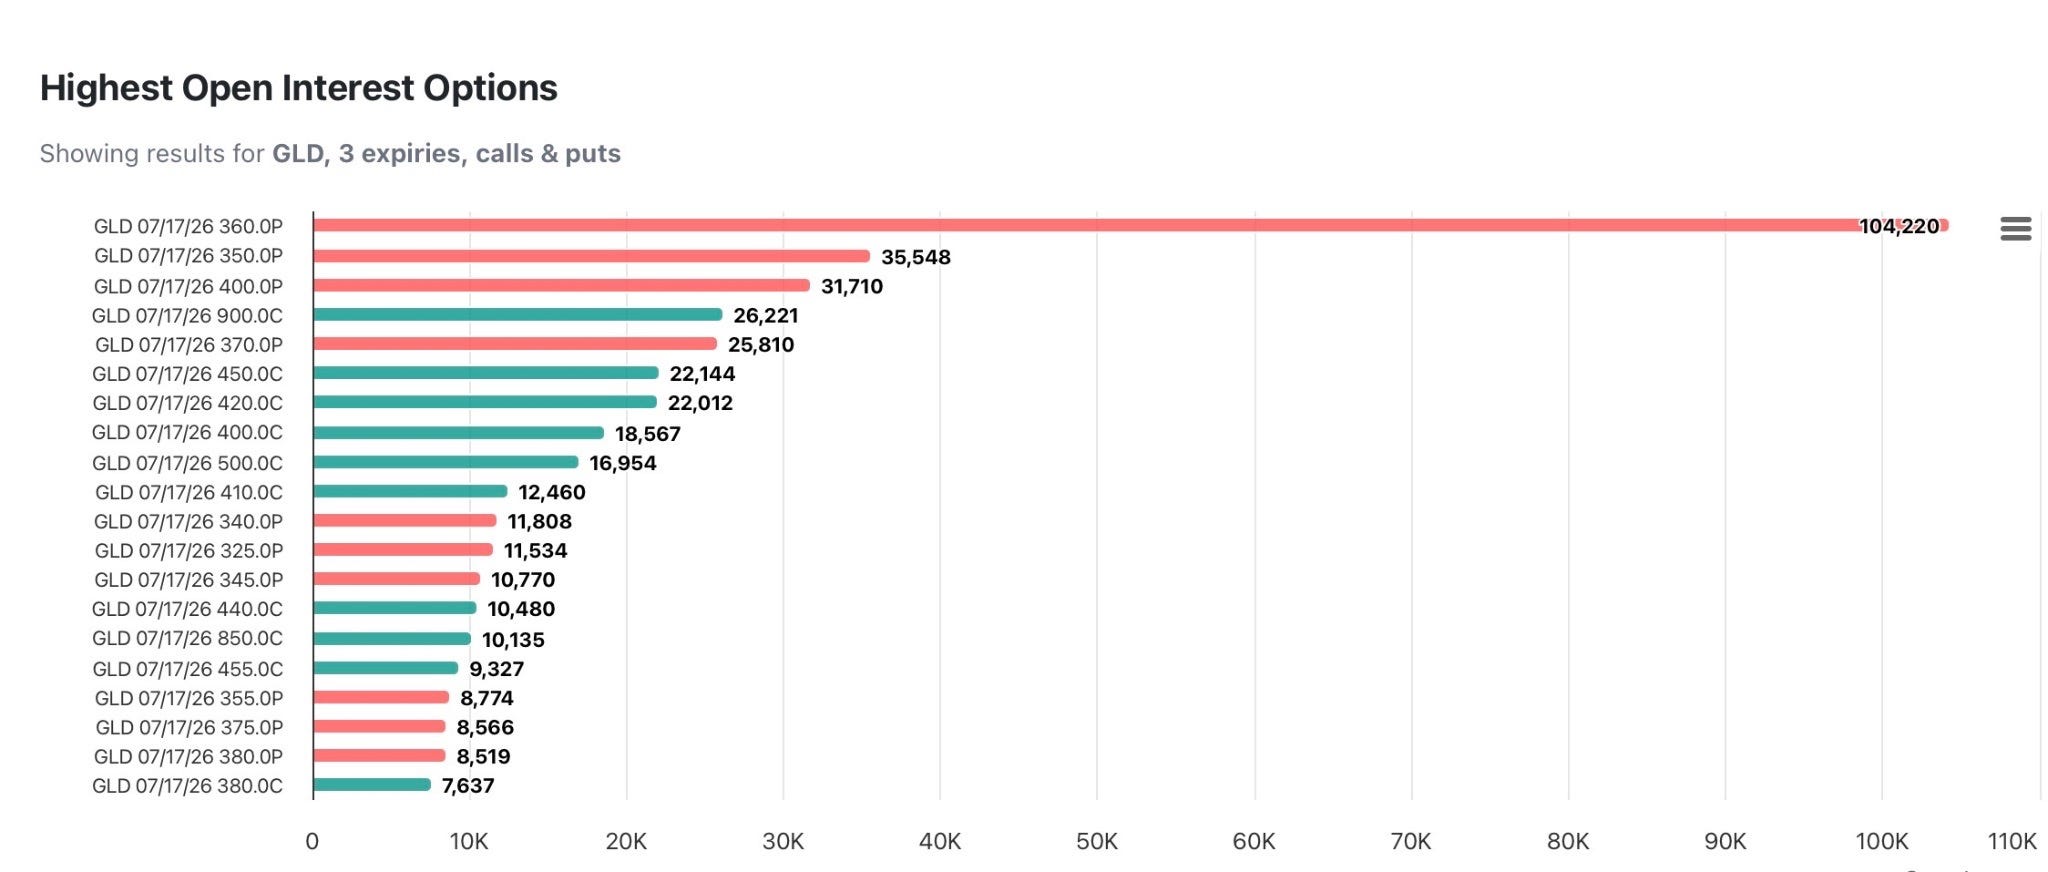
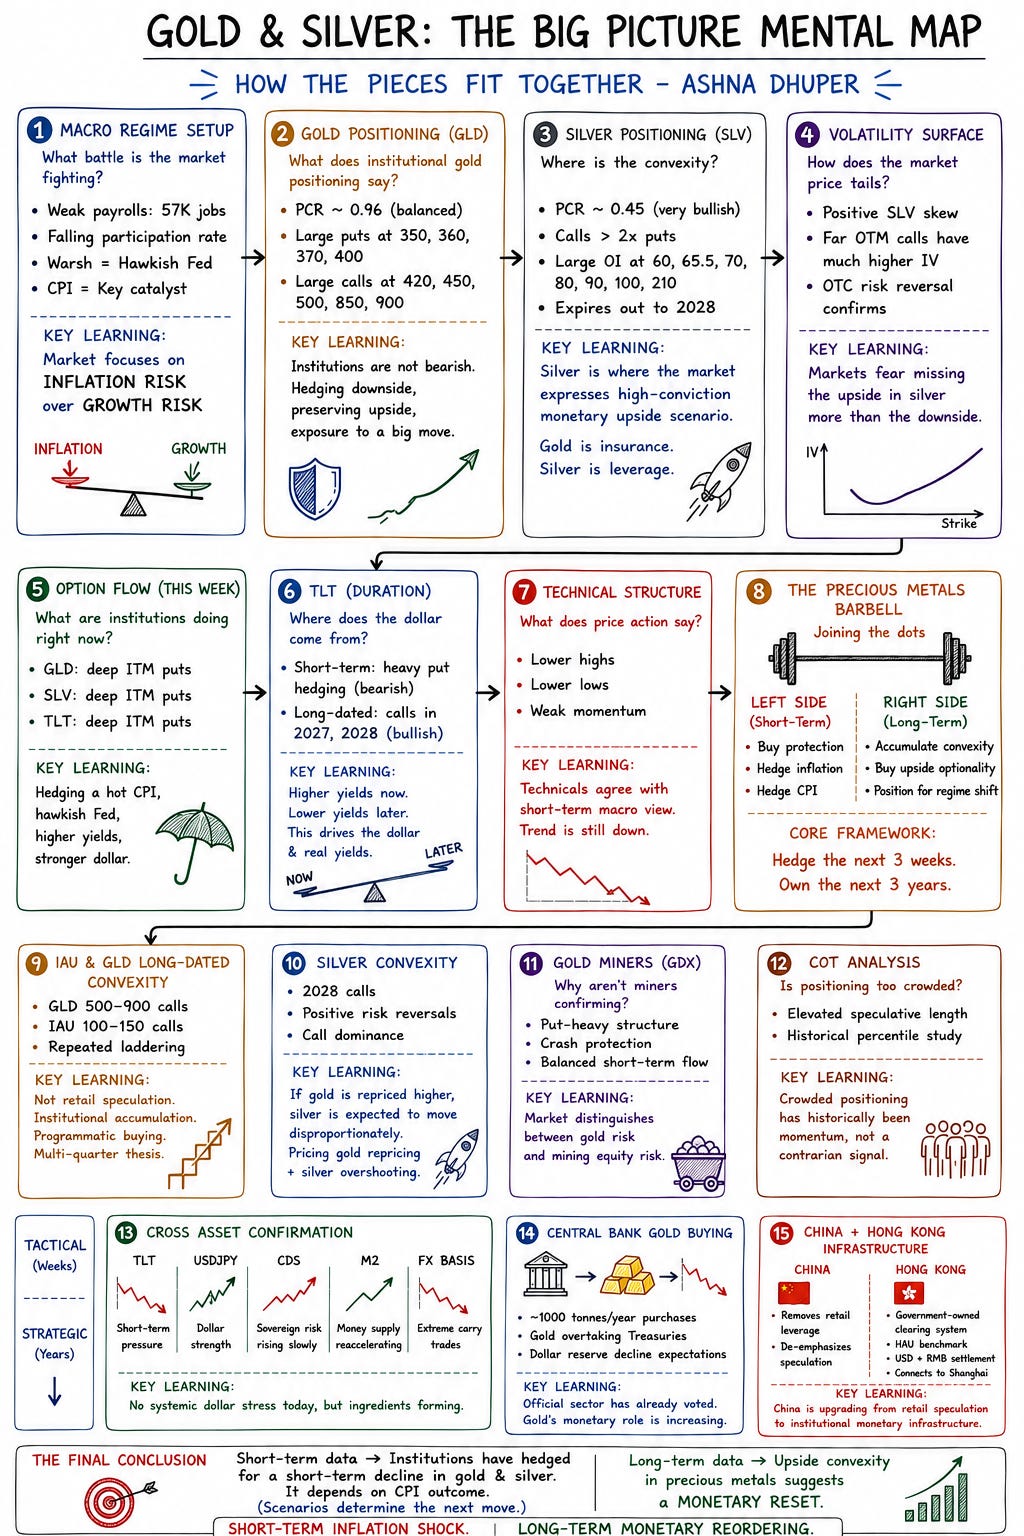
Gold options positioning reflects this tension. GLD open interest remains broadly balanced with roughly 349,000 calls versus 335,000 puts, producing a put-call ratio of 0.96. Large put open interest is concentrated at 350, 360, 370 and 400 strikes, while substantial call exposure remains at 420, 450, 500 and even extreme upside strikes such as 850 and 900. Institutions therefore appear to be hedging short-term downside risks while preserving exposure to a larger upside move under a monetary or policy shock scenario.
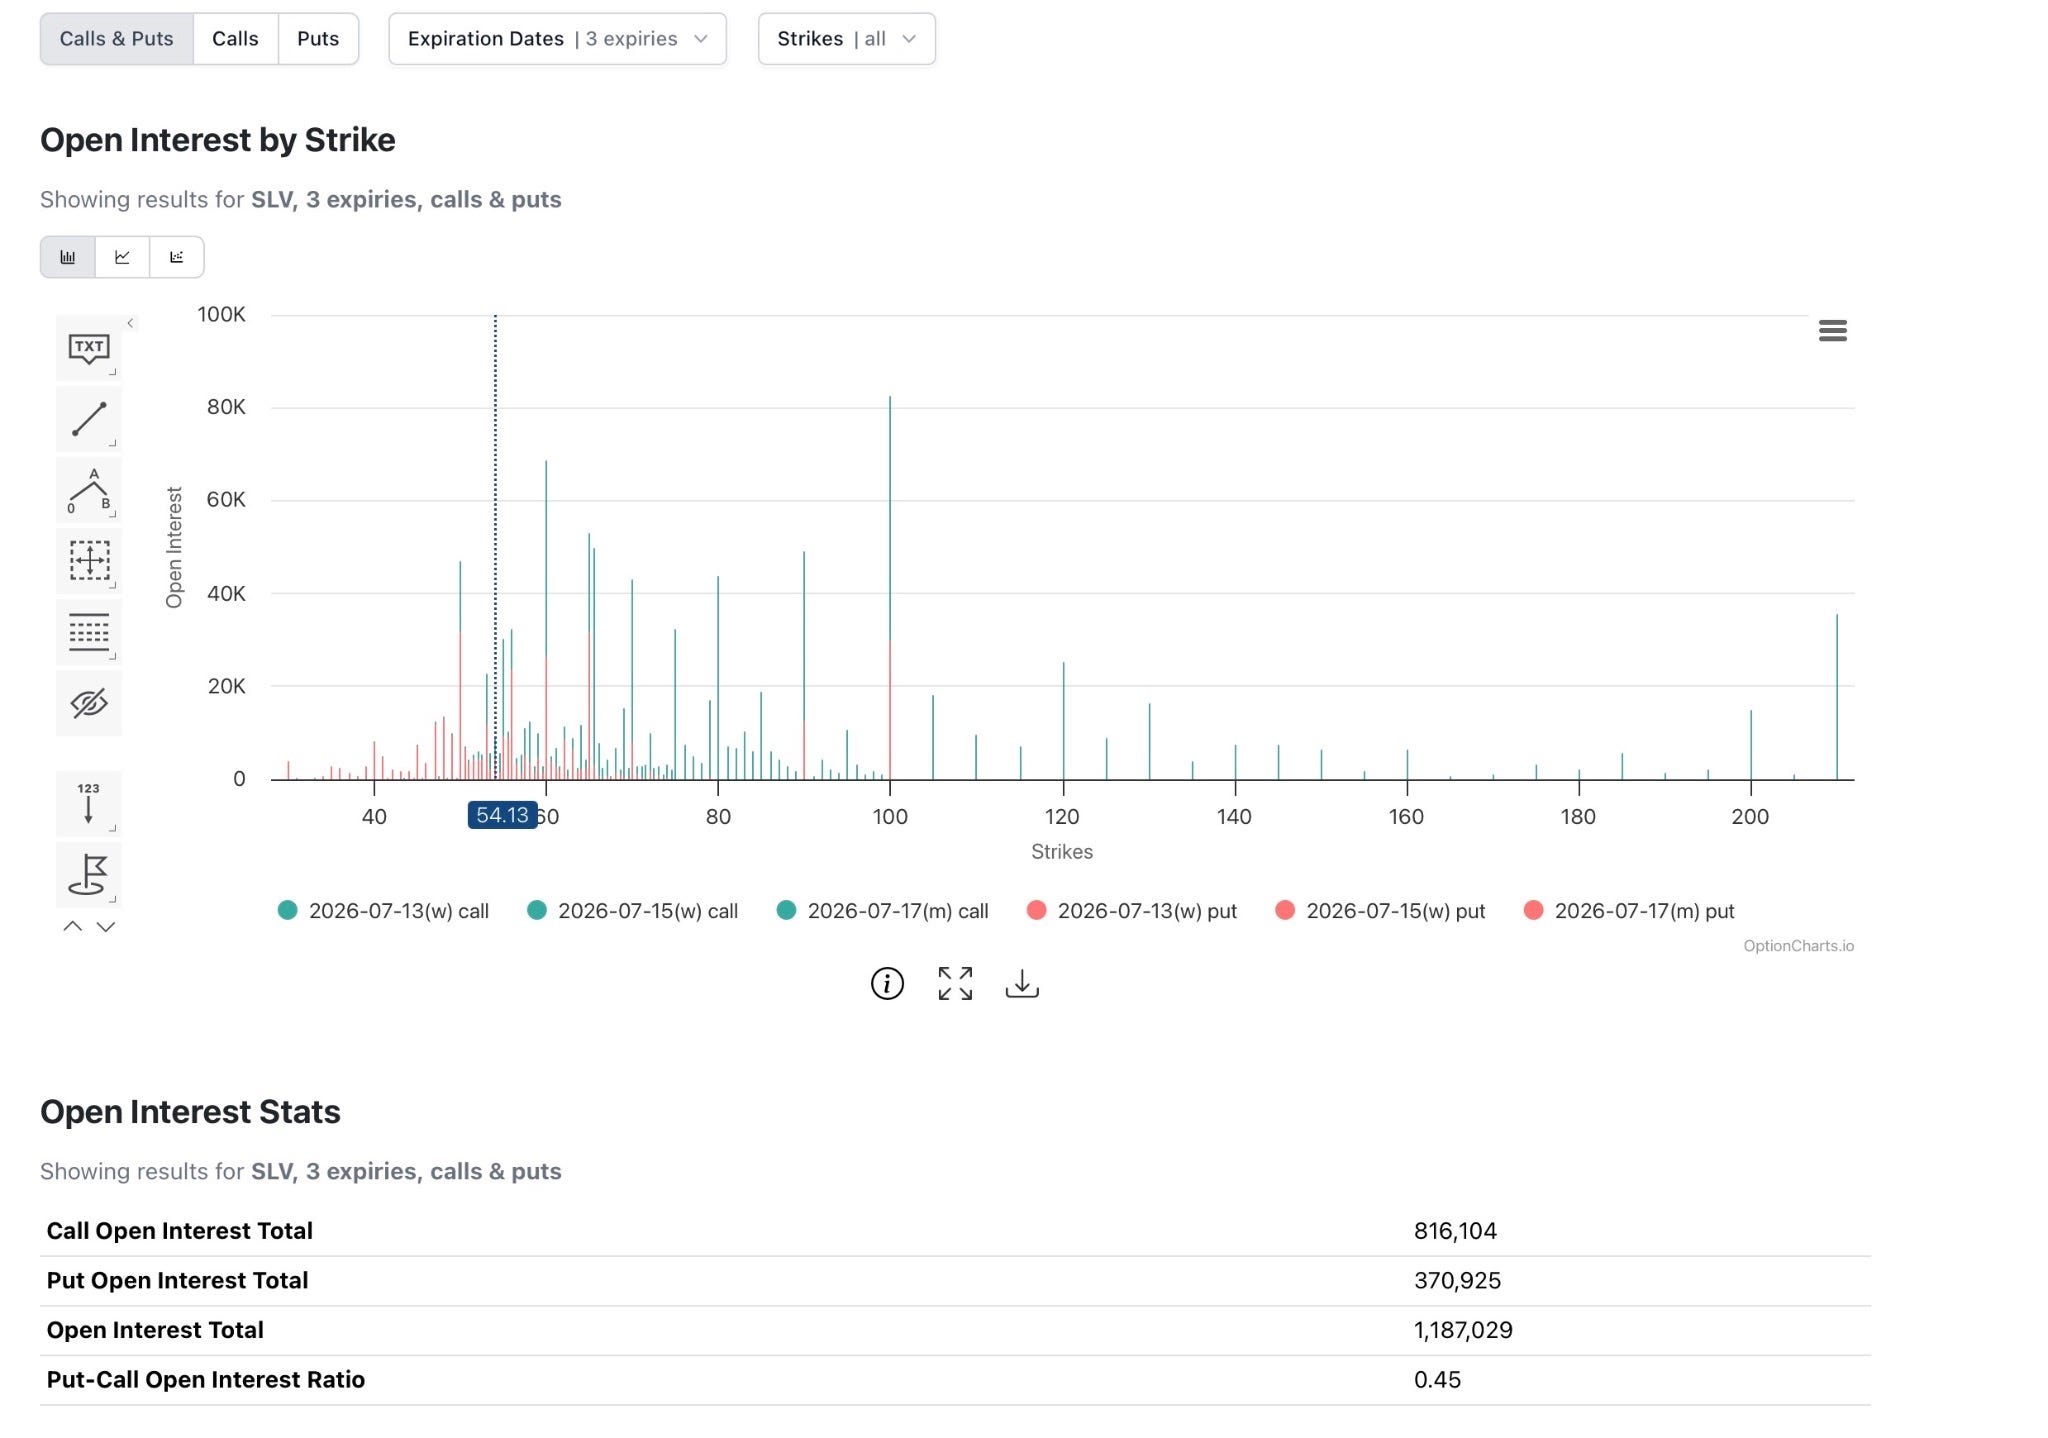
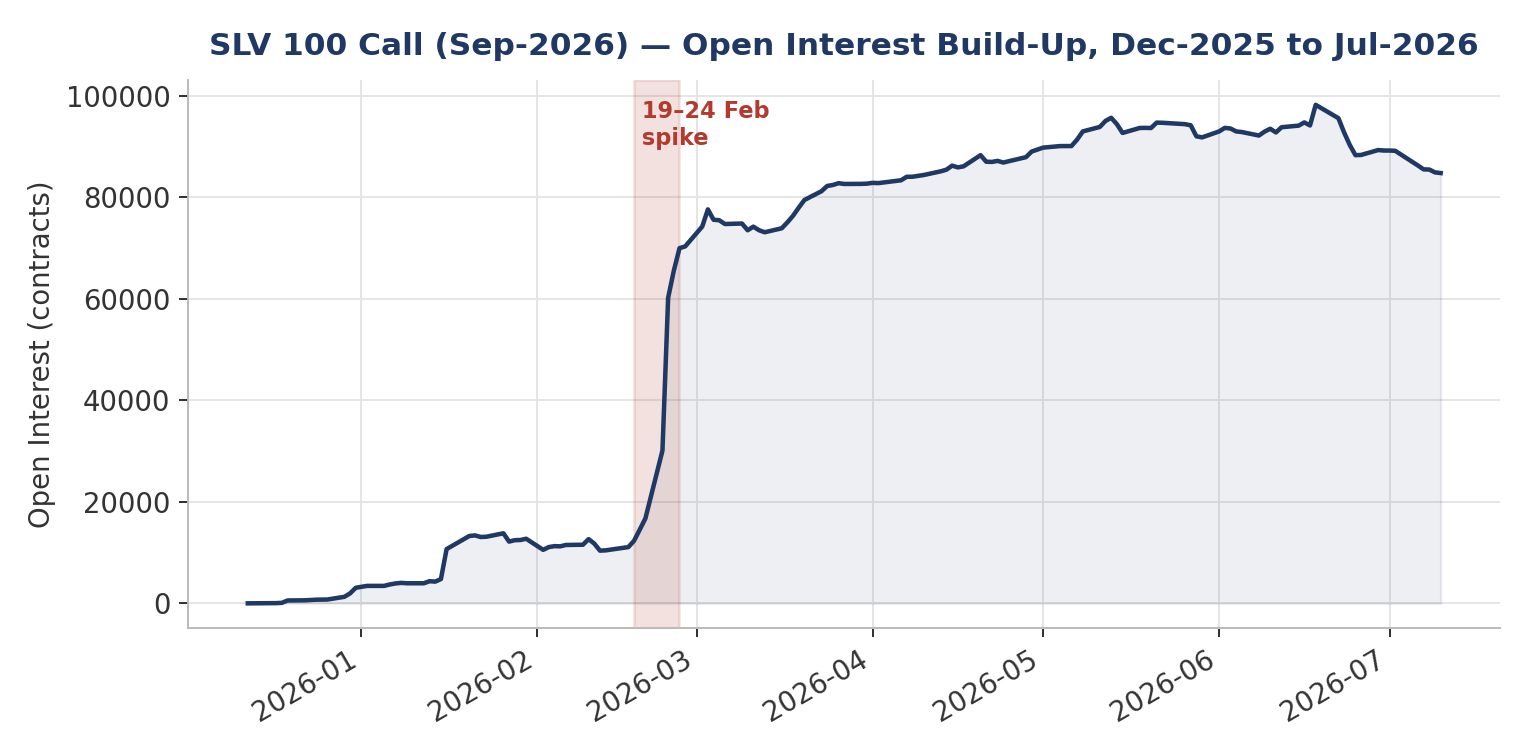
Silver positioning is significantly more bullish. SLV open interest shows approximately 816,000 calls versus 371,000 puts, resulting in a put-call ratio of just 0.45. Calls outnumber puts by more than two-to-one, with large open interest concentrations at 60, 65.5, 70, 80, 90, 100 and even 210 strikes. Such positioning is highly unusual for a commodity ETF and suggests investors continue assigning a meaningful probability to a substantial upside repricing event in silver later this year. Structurally, silver remains one of the most bullish option markets in the macro universe.
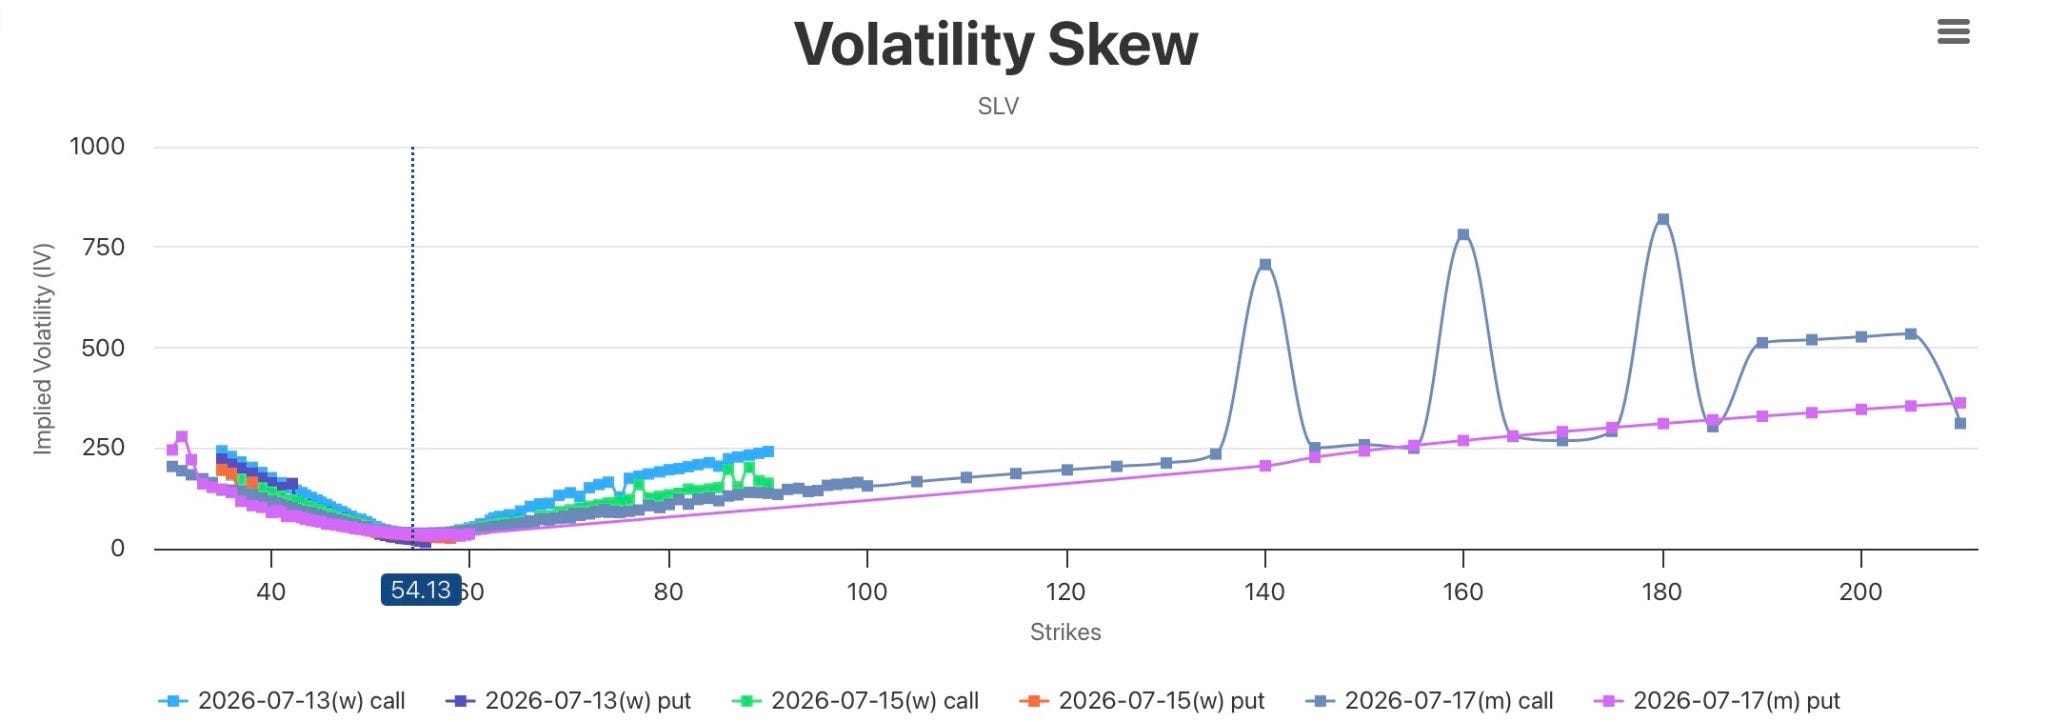
The volatility skew reinforces the bullish long-term positioning in silver. Under normal market conditions, downside puts trade at higher implied volatility because investors pay for crash protection. In SLV, however, far out-of-the-money calls trade at implied volatilities several multiples higher than comparable puts, with some upside strikes exhibiting exceptionally elevated IV levels. Markets only price upside optionality this aggressively when investors assign a meaningful probability to a monetary regime shift, policy error or major macro event rather than a normal cyclical move. The skew therefore suggests that while investors remain cautious in the near term, they continue to see substantial long-term upside risk in silver.
Option flow, however, tells a more tactical story. Unlike open interest, which reflects longer-term positioning, flow captures what institutions are doing today. In GLD, much of the put activity occurred in deep in-the-money strikes such as the 420, 425 and 430 puts while spot traded near 375. These contracts sit roughly 12-15% above spot and behave more like synthetic futures positions or portfolio insurance than speculative bearish bets. Such structures are commonly used by large investors to hedge existing gold exposure ahead of major macro events such as CPI and FOMC meetings, making the flow more indicative of event hedging and risk management than outright bearish conviction.
SLV flow conveys a similar message. Recent trading showed negative net call premium and modest defensive positioning, but there was little evidence of panic downside hedging or aggressive speculative put buying. Call volumes continued to exceed put volumes and put-call volume ratios remained relatively low, suggesting investors were reducing risk into CPI rather than positioning for a major decline in silver prices. The market appears to be stepping back from risk temporarily while maintaining the structurally bullish view implied by open interest and volatility skew.
The Treasury market provides the final and perhaps most important piece of the puzzle because it drives yields and ultimately the direction of the US dollar. TLT option flow showed substantial demand for downside protection and reduced duration exposure heading into CPI. Similar to GLD, much of this activity occurred in deep in-the-money puts rather than speculative downside trades, suggesting investors are hedging duration risk rather than betting on a collapse in Treasuries. The message is clear: investors do not want to own duration if inflation surprises to the upside and forces markets to price additional tightening.
This matters because the transmission mechanism runs through Treasury yields and the dollar. A hotter CPI would likely push yields higher, weaken TLT, strengthen the dollar and increase real yields, an environment that is typically bearish for both gold and silver, particularly silver because of its greater sensitivity to changes in real yields and growth expectations. The technical picture supports this view, with both gold and silver remaining in medium-term downtrends characterized by lower highs, lower lows and weak momentum.
Taken together, two different time horizons emerge. The tactical market is pricing sticky inflation, a hawkish Federal Reserve, higher Treasury yields, a stronger dollar and short-term pressure on precious metals. This view is visible in recent option flow, Treasury positioning and technical charts. The strategic market, however, continues to price weakening growth, eventual policy normalization and lower yields later in the year. This view is visible in gold’s balanced open interest profile, silver’s extremely bullish put-call ratio and the upside volatility skew across precious metals options.
The highest probability outcome this week is therefore a continuation of the hawkish narrative, with CPI keeping the Fed cautious and maintaining upward pressure on yields and the dollar into the July FOMC meeting. Under such a scenario, gold is likely to remain under pressure or trade sideways with a negative bias, while silver may underperform due to its higher sensitivity to real yields.
However, the market is not positioned for a prolonged bear market in precious metals. Institutions are hedging against a short-term inflation shock rather than aggressively betting on one. If inflation surprises lower, or if markets begin to place greater emphasis on trimmed inflation measures that remove temporary outliers, positioning could reverse quickly. In that environment yields would likely fall, the dollar would weaken, gold would rally sharply and silver would likely outperform significantly due to its highly asymmetric options positioning.
The overall message from macro data, option flow, open interest, volatility skew and Treasury positioning is remarkably consistent: institutions are hedging short-term inflation risk and a stronger dollar while quietly preserving exposure to a medium-term policy pivot driven by slowing growth and eventually softer inflation.
Usually, in such scenarios, central bank may allow inflation to run moderately above interest rates and reduce debt burdens through negative real yields.
The long-dated convexity book keeps growing at the same time this short-dated protection is being built, which is exactly the barbell pattern described throughout this report, just visible here at a much shorter time horizon than anywhere else in the data.
Gold ETF Options — IAU and GLD
IAU (iShares Gold Trust)
Spot at time of sampling: ~$77–78.
Strike & expiry breadth
Call open interest is stacked well above spot rather than clustered near the money: the largest single lines are the 100, 105, and 150 strikes on the Jan-2027 expiry (7,758 / 4,242 / 2,724 contracts), with additional size at 110, 120, 125, 130 — strikes 30–90% above spot.
Call/put OI ratio widens sharply with tenor: 1.5x at the near Sep-2026 expiry vs. 8.3x at Jan-2027, the upside skew is concentrated in the longer-dated contract, consistent with patient convexity accumulation rather than a short-term trade.
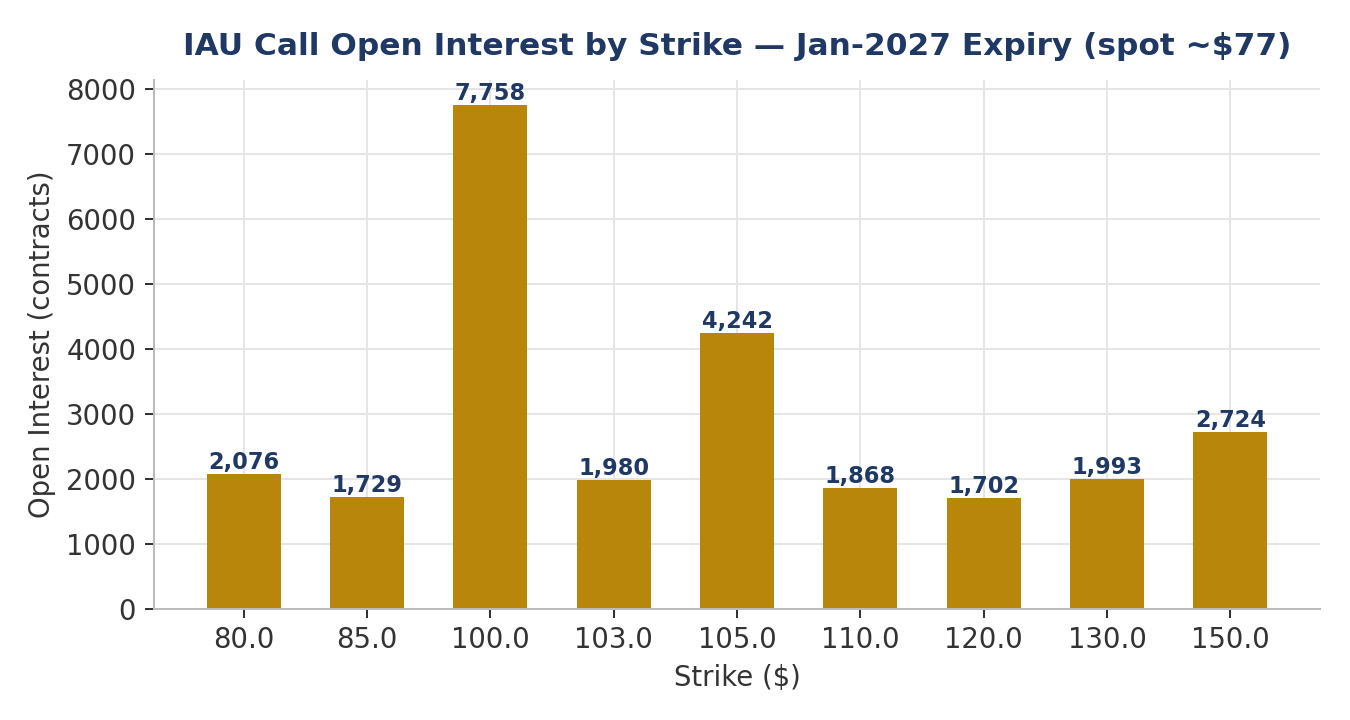
IAU call open interest concentrates far above spot, not at the money.
Implied volatility
Term structure is in mild contango: ATM IV rises from 21.9% (Aug-2026) to 25.3% (Jan-2028), no near-term panic priced, but the market pays up for optionality further out.
The Jan-2027 call wing steepens sharply above the 100 strike, reaching 45–49% IV at the 150–155 strikes, while the Jan-2028 wing is comparatively flat over the same relative distance — the market’s own pricing currently leans toward a move materializing within ~18 months rather than later.
Options Flow
The largest individual prints are deep-in-the-money January 2027 110 puts with deltas of approximately -0.73 to -0.75, totaling roughly $1.05 million of premium across four blocks. These behave more like leveraged synthetic shorts or institutional hedges than speculative bearish bets on gold.
GLD (SPDR Gold Trust)
Spot at time of sampling: ~$377–378. GLD options trade roughly 10-20 times the option volume of IAU, while GLD AUM are approximately 3-4 times larger than IAU.
Strike breadth — the 500–900 band
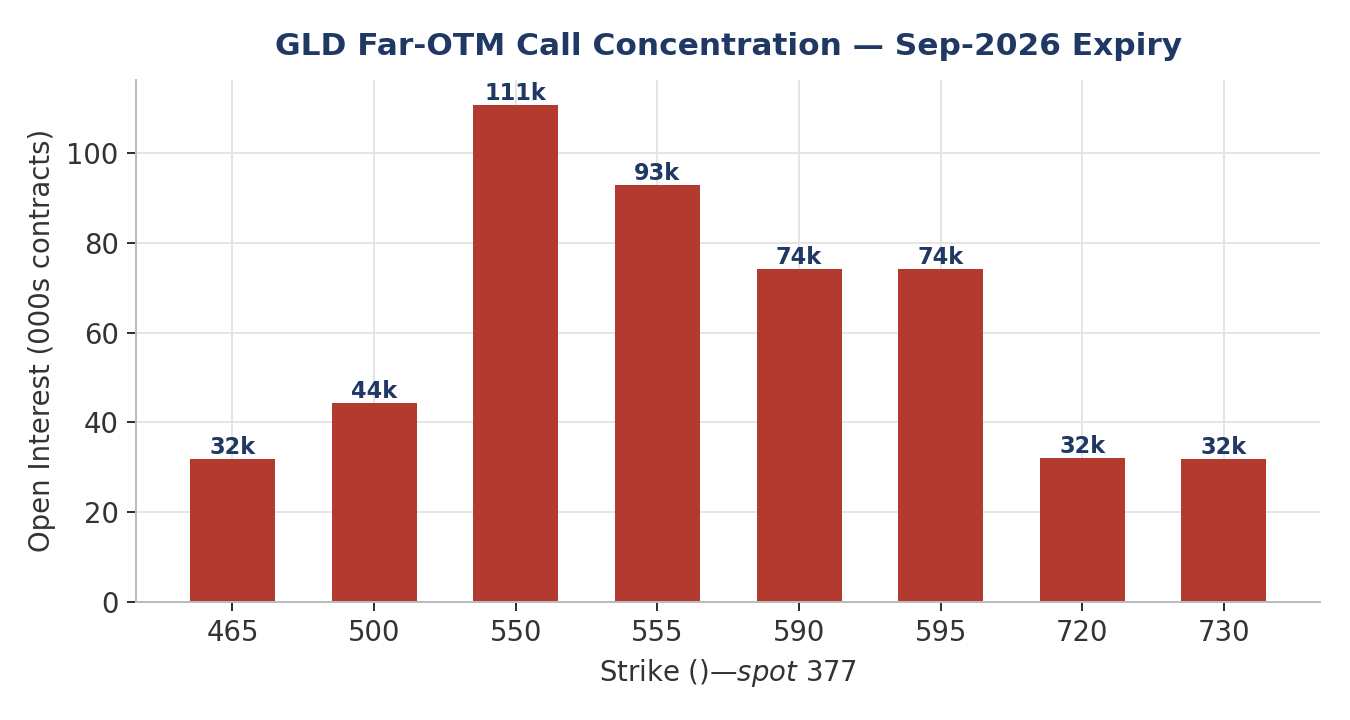
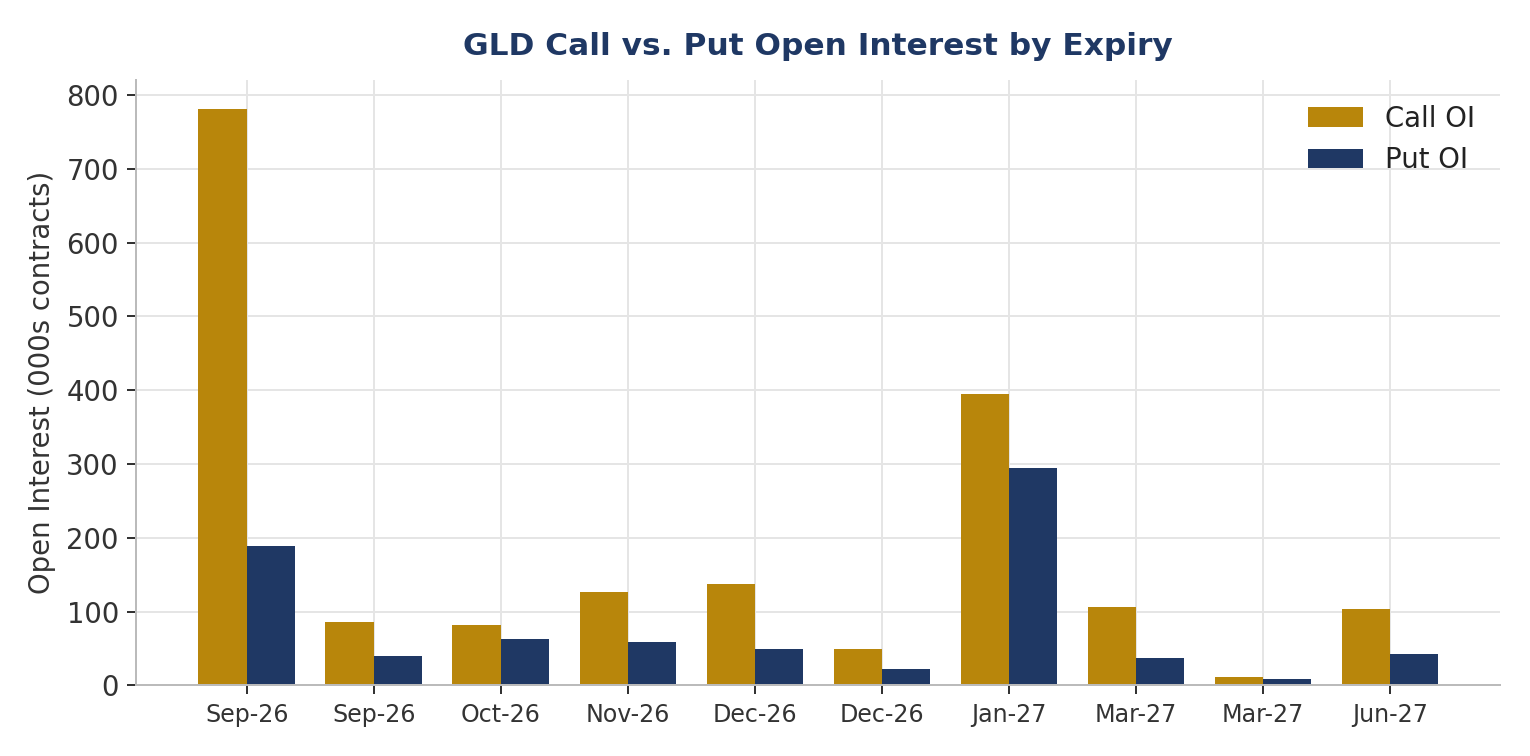
59.5% of all GLD call open interest (1,117,038 of 1,878,002 contracts) sits in the 500–900 strike band — 30% to 135% above spot. A substantial share of this is traceable to a single identifiable block: a 110,033-contract print of the 550 call (Sep-2026 expiry) on 5 June 2026 for $10.34M premium (~$0.94/contract) essentially the entire resting open interest at that strike.
Expiry breadth
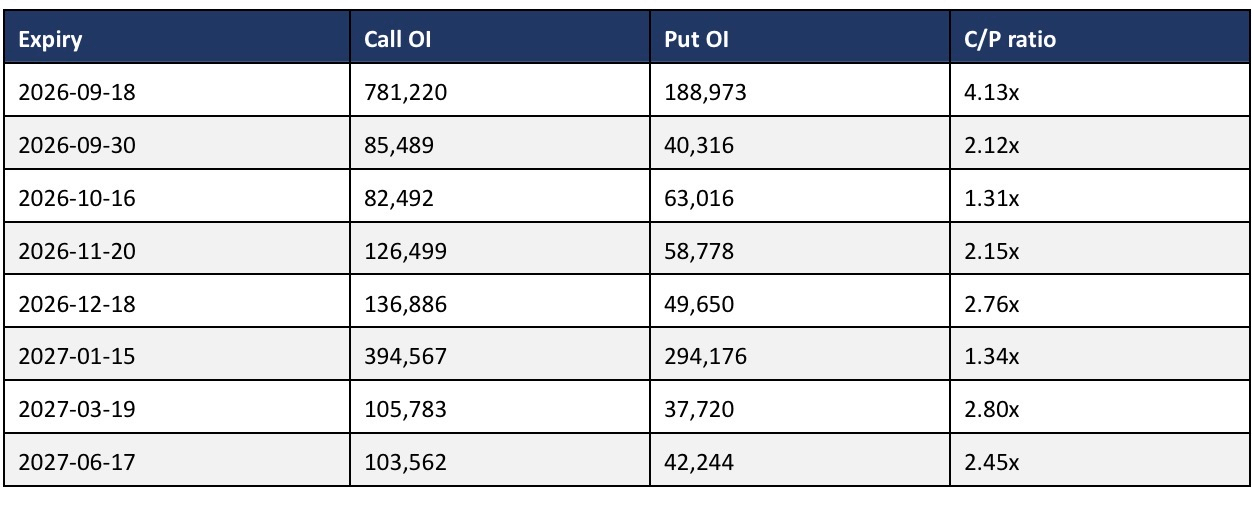
Unlike IAU, whose skew widens with tenor, GLD’s richest call/put ratio sits in the near Sep-2026 expiry driven substantially by the single 550C block. Excluding that block, the term structure flattens considerably; the two ETFs are not yet telling the same “when” story.
Implied volatility
ATM term structure: mild contango, 22.3% (Sep-2026) to 23.8% (Mar-2027) — consistent with IAU.
The OTM call wing inverts this: at the 900 strike, Sep-2026 IV is 65.9% vs. only 49.8% for the same strike in Jan-2027 — the near expiry’s tail is richer than the far expiry’s, the market’s own fingerprint of concentrated near-dated demand (i.e., the 550C-type activity).
Food for thought
Historical analysis by the World Gold Council shows that gold has generated an average 7.5% return over the six months following major geopolitical shocks. Using 1 March as the starting point with gold trading near $5,420 per ounce immediately after the outbreak of the conflict, a move in line with historical averages would imply a price near $5,826 per ounce by September. This corresponds approximately to a $500-$550 GLD equivalent, a range that aligns closely with the concentration of September upside call positioning currently visible in the options market. The overlap between historical precedent and options positioning suggests that institutional investors may be anchoring expectations around a similar post-shock trajectory for gold prices.
Flow , recurring laddering, not a single trade
Daily open-interest history on four separate far-OTM contracts reveals a repeating pattern of large single-day adds, roughly every 4–8 weeks, across different strikes and expiries:
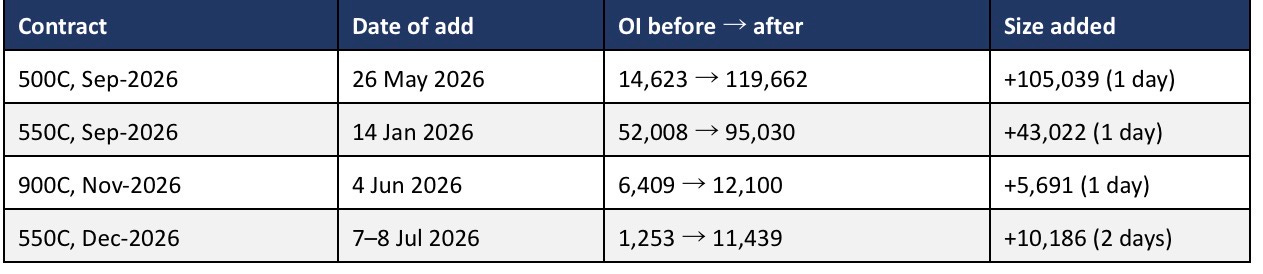
Important context check: the broad market’s aggregate GLD call OI peaked near 4.7 million contracts around Feb–Mar 2026 in step with gold’s price peak and has since fallen to roughly 2.70 million as price pulled back. The crowd’s book is shrinking with the price decline (ordinary momentum-chasing); the specific far-OTM laddering documented above is going against that grain, adding exposure into the pullback rather than with it.
The largest recent (≥$50K premium) prints are dominated by deep-ITM put buying: ~$70M combined across the 500P/510P (Sep-2026) and 520P/510P/600P (Jan-2027) strikes, delta −0.93 to −0.98 — behaving as synthetic shorts/hedges on existing exposure rather than speculative bearish conviction.
Cross-Asset Breadth — Silver (SLV)
Spot: $53.95.
Build-up pattern: organic, not laddered
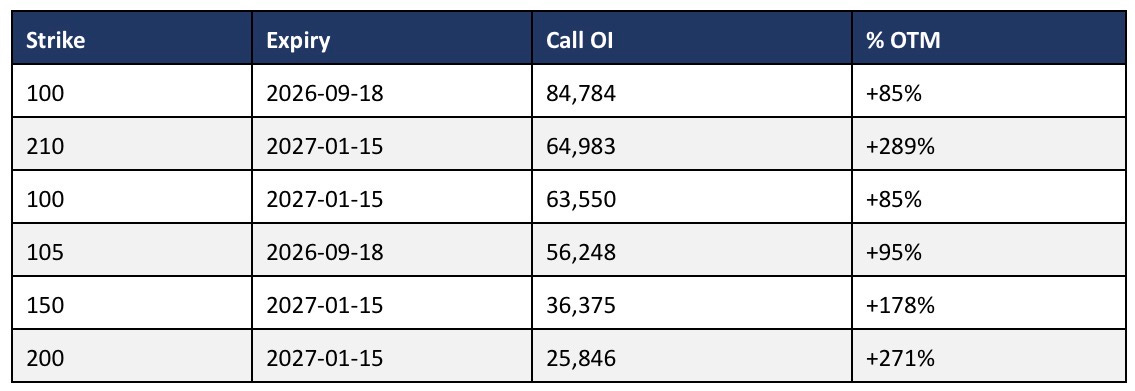
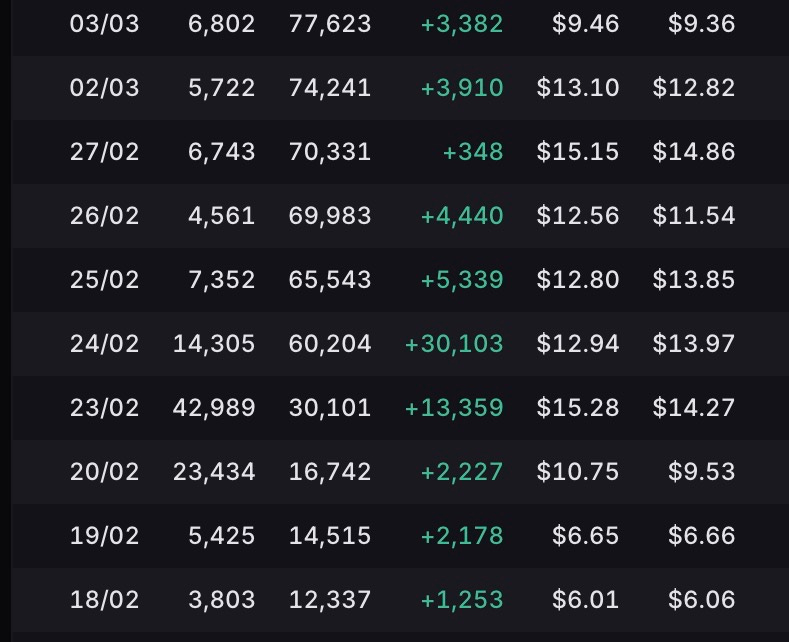
Daily open-interest history on the 100C and 150C (Sep-2026) shows a materially different mechanism than GLD’s block-trade laddering:
Gradual build from zero starting mid-December 2025 / mid-January 2026.
A sharp, simultaneous surge 19–24 February 2026 — the 100C jumped from 16,742 to 70,331 open interest in one week as the underlying spiked (option price rose from $6.65 to over $15 before reversing). This is the same window in which GLD’s aggregate call open interest peaked — both markets’ options books chased a real, sharp gold/silver rally simultaneously.
A plateau through spring with continuous small day-to-day additions (many small trades, not a few large ones), followed by a slow bleed-down since mid-June as the options decay toward worthless with the underlying’s pullback.
This looks like organic, momentum-chasing accumulation by a broad base of participants, concentrated in a real emotional spike window — a different behavioral signature from gold’s programmatic laddering, even though both point toward the same directional conviction.
Term structure and cross-check via OTC risk reversals
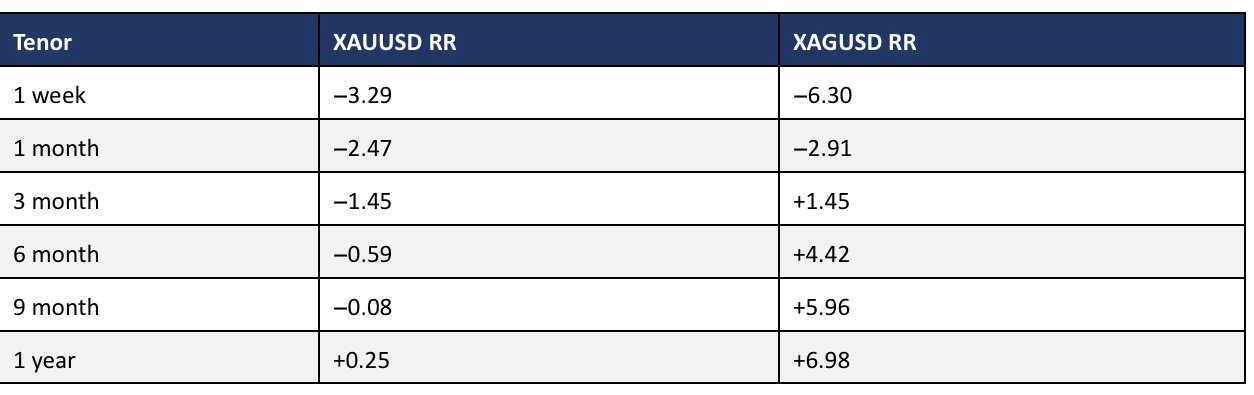
Silver’s implied volatility runs roughly 1.8x gold’s (ATM ~38–40% vs. ~22%), consistent with its higher beta and more momentum-driven positioning. The OTC XAU/XAG 25-delta risk reversal data independently confirms silver’s stronger upside skew at every tenor beyond one month, with the 1-year risk reversal at +6.98 for silver vs. only +0.25 for gold — two unrelated markets telling the same relative story.
RR Negative → puts are more expensive than calls → market pays more for downside protection.
RR Near zero → upside and downside risks are priced similarly.
RR Positive → calls are more expensive than puts → market is paying for upside exposure.
The three most important data points from the SLV flow are:
First, institutional hedging in silver was overwhelmingly concentrated in deep in-the-money puts rather than speculative downside bets. Of the approximately $90.7 million in qualifying premium, roughly 97.3% was bearish premium, with almost all of it concentrated in the 90 and 100 strike puts expiring 17 July 2026. With SLV trading near $54, these strikes were already 65-85% in the money, making them behave more like synthetic short futures positions or portfolio insurance rather than directional wagers on a collapse in silver prices.
Second, the market witnessed one of the largest individual option trades in the entire dataset: a $37.7 million purchase of 10,500 contracts of the July 17 90 put on 9 July. The size and structure of this trade make it difficult to classify as speculative positioning. Instead, it strongly resembles institutional hedging or systematic risk reduction ahead of CPI and the July FOMC meeting.
Third, despite the extraordinary short-term hedging activity, the structural positioning in silver remains decisively bullish. Near-dated call open interest totals 816,104 contracts versus only 370,925 puts, resulting in a put-call ratio of just 0.45. Furthermore, open interest now extends as far as 2028 expiries, with meaningful call positions at strikes such as 102, 116 and 150, confirming that investors continue to maintain multi-year upside exposure even while aggressively hedging near-term macro risks.
Taken together, the flow suggests that institutions are not positioning for a structural bear market in silver. Instead, they are hedging against a short-term inflation and Fed risk event while preserving exposure to a longer-term upside regime shift in precious metals.
Gold Miners — GDX
Spot: $75.66.
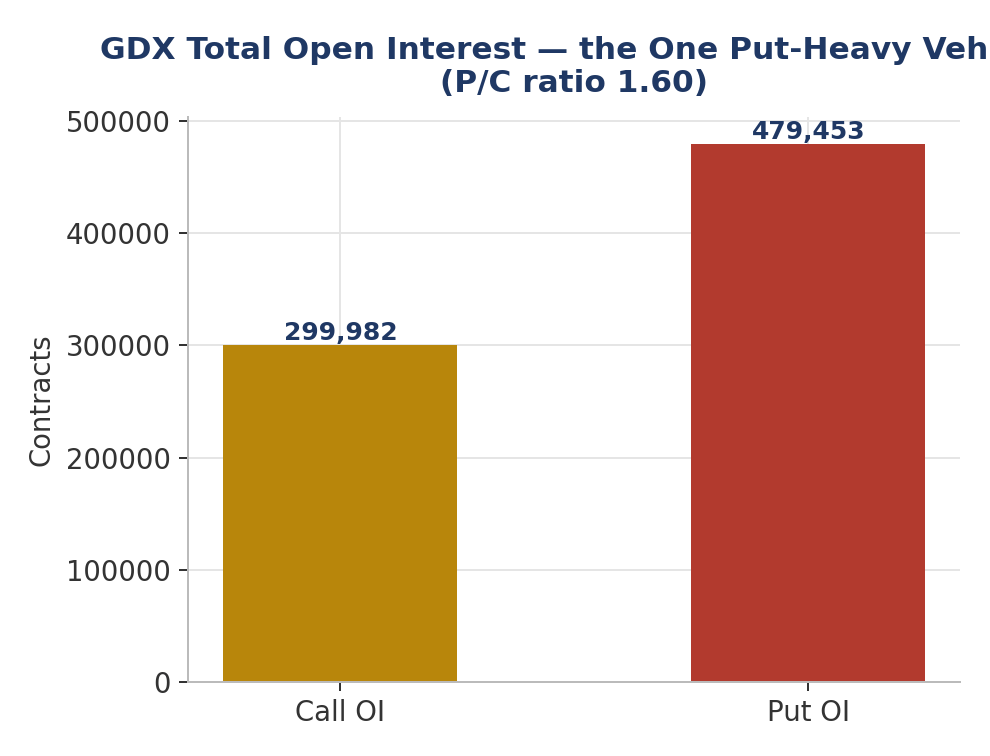
GDX is the only vehicle in this study where puts outnumber calls.
The put OI splits into two distinct trades
Near-the-money protective puts: 75P Jan-2027 (20,004 OI, the single largest line in the chain, −0.9% from spot), 70P Jan-2027 (15,852, −7.5%), 80P Jan-2027 (13,348, +5.7%), plus similar strikes across Dec-2026 and three further expiries at the 65-strike. Ordinary portfolio insurance on existing miner longs.
Deep, far-OTM crash puts: 25P Dec-2026 (14,955 OI, −67.0% from spot), 26P Dec-2026 (10,983, −65.6%), 30P Dec-2026 (9,127, −60.3%), 35P Jan-2027 (9,668, −53.7%) — four strikes, all requiring GDX to lose more than half its value, concentrated in the same Dec-2026/Jan-2027 window.
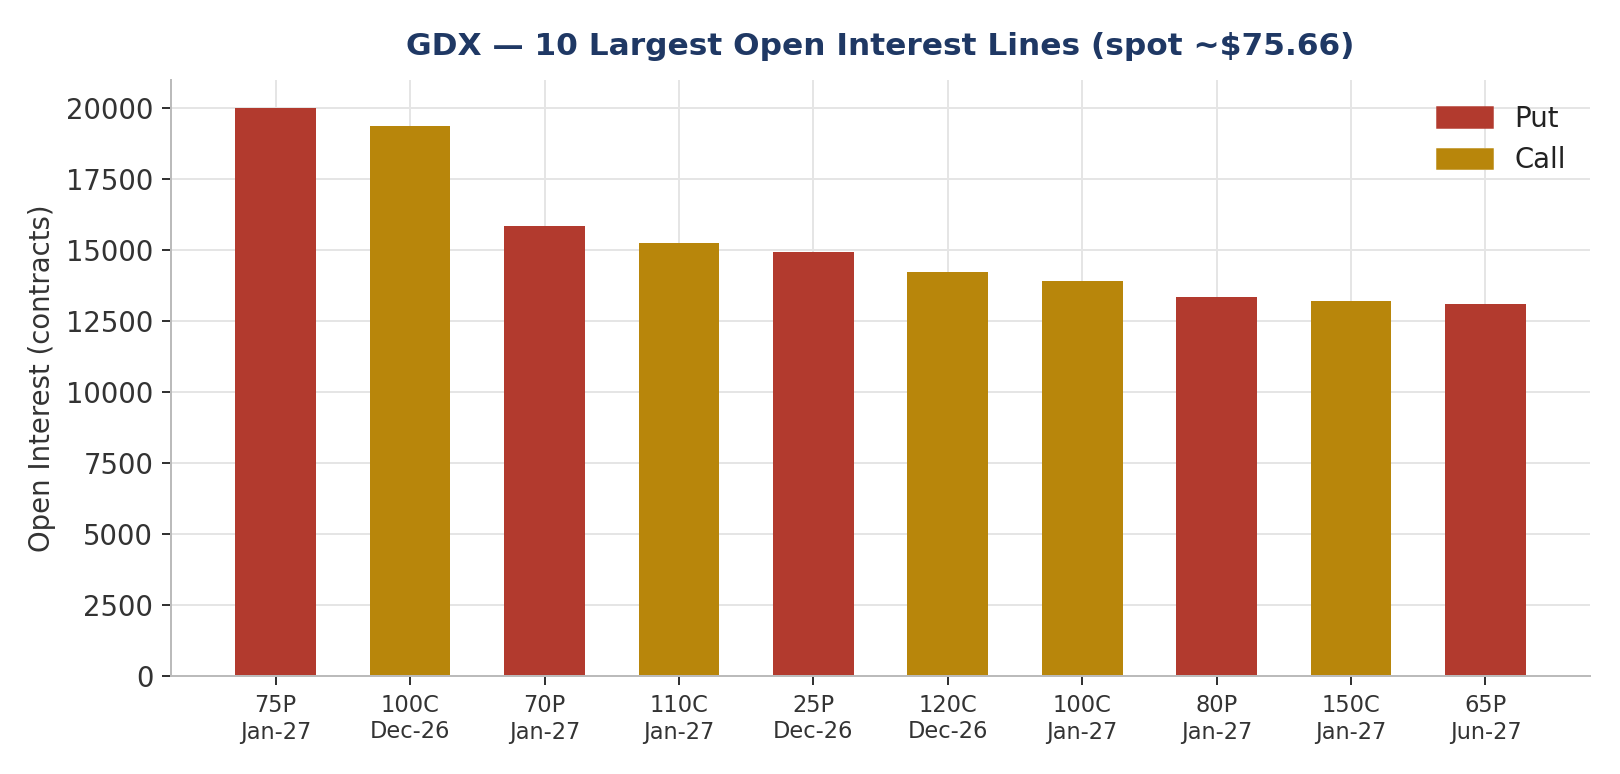
GDX’s 10 largest open-interest lines split between near-money hedges and far-OTM convexity.
Volatility skew confirms the two-tier structure
ATM term structure is inverted relative to the metals — backwardation, not contango: 46.9% (Sep-2026) declining to 41.8% (Jan-2027). Near-term IV exceeds far-dated IV, unlike IAU/GLD/SLV, consistent with genuine near-term event risk specific to miners (operating leverage, costs, equity-market beta) layered on top of the gold-price view.
Comparing put IV to call IV at equal distances from spot (Jan-2027 expiry): the skew is nearly symmetric out to about ±47% OTM (a normal equity-options shape), then inflects sharply past −50–67%, where put IV reaches 70–82% against equivalent-distance calls at only ~47–48%. The extra insurance premium is localized exactly where the crash-put open interest sits — not a market-wide “miners could crater” repricing, but a sharp, targeted premium for a specific severe-drawdown scenario.
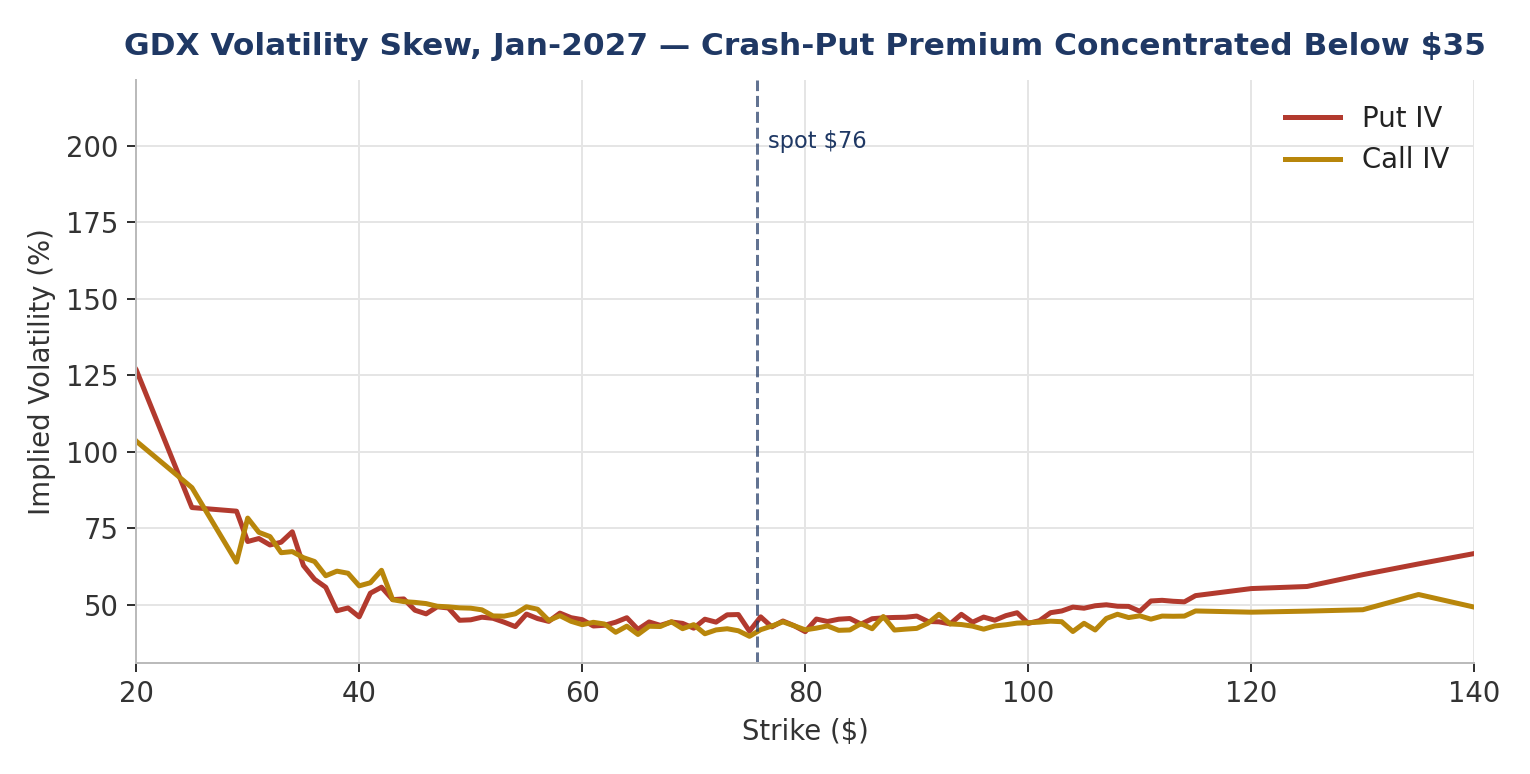
GDX put IV spikes sharply below $35 — a targeted crash premium, not a broad skew.
GDX does not read as bearish on gold. It reads as “hedge the equity-specific/near-term risk while running convexity on the metal” — a more sophisticated stance than the headline put-heavy ratio suggests on its own.
GDX did not join the CPI-window put campaign to the same degree
Applying the same near-dated flow lens used on GLD and SLV to GDX shows a much more balanced picture: of $33.7M in qualifying premium (25 June–10 July 2026), only 56% was bearish ($19.0M) versus 44% bullish ($14.7M) nowhere near GLD’s and SLV’s ~98% one-directional tilt. Only $9.0M of GDX’s total near-dated premium sits in the 17 July expiry specifically, versus the overwhelming concentration seen in the metals. GDX’s near-term book looks like normal two-sided trading around the data window, not a large, deliberate hedge campaign reinforcing that GDX’s put-heavy character is about miner-specific and crash-tail risk on a longer horizon, not a reaction to this particular week’s catalysts.
CFTC Commitments of Traders — Gold Futures
Legacy report, positions as of 07 July 2026. Gold futures (100oz, COMEX), total open interest 371,776 contracts (+2,235 week-over-week).
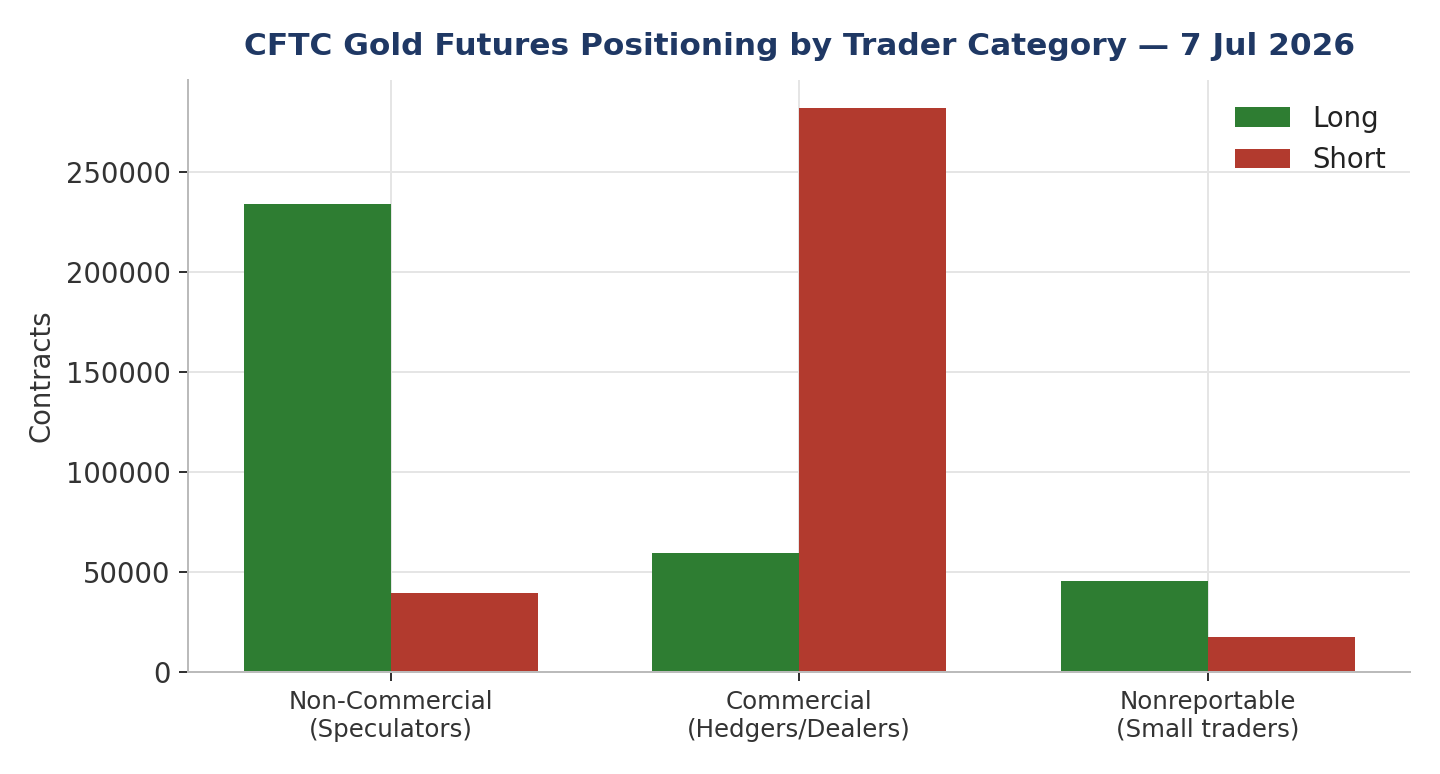
Speculative net-long positioning at 52% of open interest (long minus short, as a share of OI) is historically stretched by the legacy classification. This is a broader bucket than the “Managed Money” category tracked separately (which stood at 25.7% net long as of March 2026, versus prior cycle peaks in the 40–44% range in 2009–10 and 2016–17) — the two series are not directly comparable, but both point to crowded, though not unprecedented, speculative positioning. The commercial net-short side is large but structurally ordinary for this stage of a rally: producers and bullion banks hedge forward as price rises.
The week’s marginal flow was more balanced than the level suggests: non-commercials added both longs (+4,094) and shorts (+3,867), for net new long of only +227 — churn at an elevated level, not a fresh aggressive push. The cleanest directional move was nonreportable (small) traders trimming exposure on both sides.
Does high positioning predict a pullback? A 20-year check
A natural worry follows: when speculators are already this long, doesn’t that usually mean a drop is coming? We tested this directly, using 20 years of weekly gold Managed Money COT data (2006–2026) matched to actual forward price returns, split into six buckets by how crowded positioning was at each point in time.
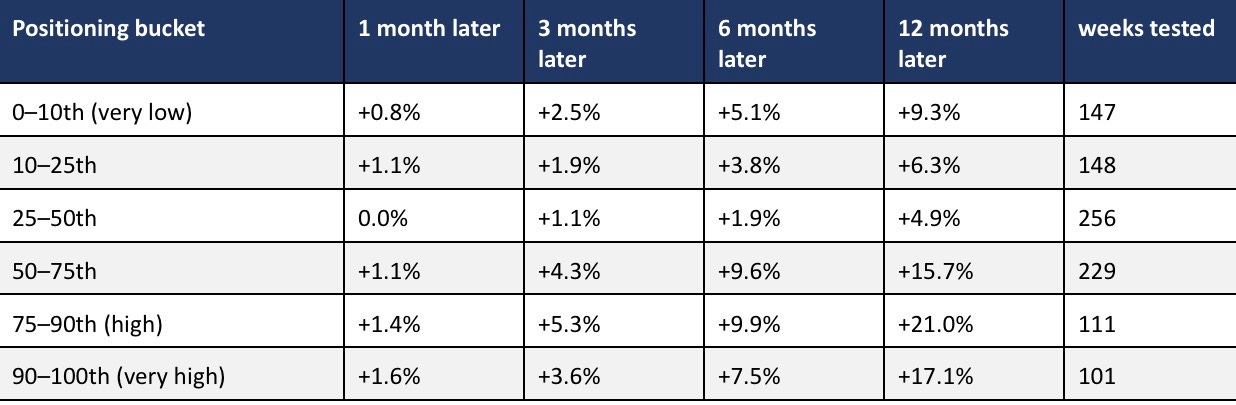
Current reading (7 July 2026): the 72nd percentile — just below the best-performing bucket in the whole table.
The result is the opposite of the common assumption. Over the full 20-year sample, higher positioning was followed by better returns, not worse (a +0.24 correlation with 12-month forward returns). The 75–90th percentile bucket close to where gold sits today had the best average returns of any bucket, not the worst. In plain terms: crowded positioning in gold has not, historically, been a reliable warning sign of an imminent drop. It has more often gone with a market that keeps trending, because the positioning reflects real, ongoing drivers (macro trends, central bank buying, a weaker dollar) rather than pure hype that snaps back.
Cross-Asset Confirmation — Rates, FX, and Credit
TLT (20+ Year Treasury Bond ETF)
Historically, currency has been a lagging indicator during monetary regime changes.
Spot: $84.55. Unlike the metals, TLT’s options book is genuinely two-sided rather than skewed hedges-under-a-long-position.

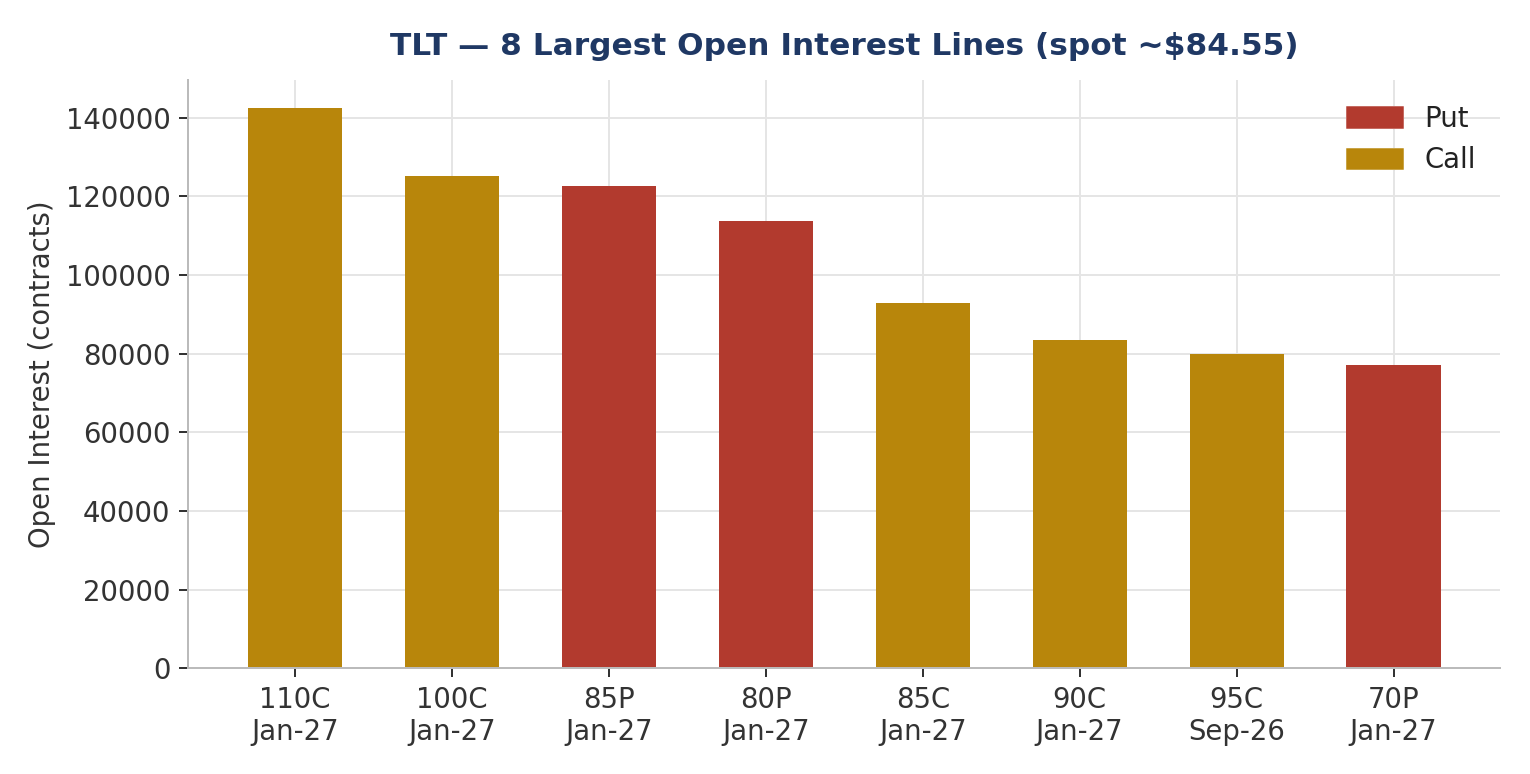
Flow confirms two distinct trades on two different clocks: a large, urgent, short-fused bearish position (four prints of the deep-ITM 100P, 5 days to expiry, ~$21.5M combined premium, all on 1 July 2026) betting on a sharp near-term bond selloff, running alongside a slower, structured, multi-tranche bullish build (30,000 lots of the 95C Jan-2028, plus repeated adds to the 85C Jan-2027) betting on a longer-fused rally. The options market has not picked a lane on what a “reset” does to long bonds — real size is betting on both a violent rally (crisis/recession, Fed forced to ease) and a violent selloff (debt-monetization/inflation) simultaneously.
XAU/XAG FX Options (OTC, interbank)
25-delta risk reversal (positive = calls pricier / upside skew; negative = puts pricier / downside skew), change 9→10 July 2026:
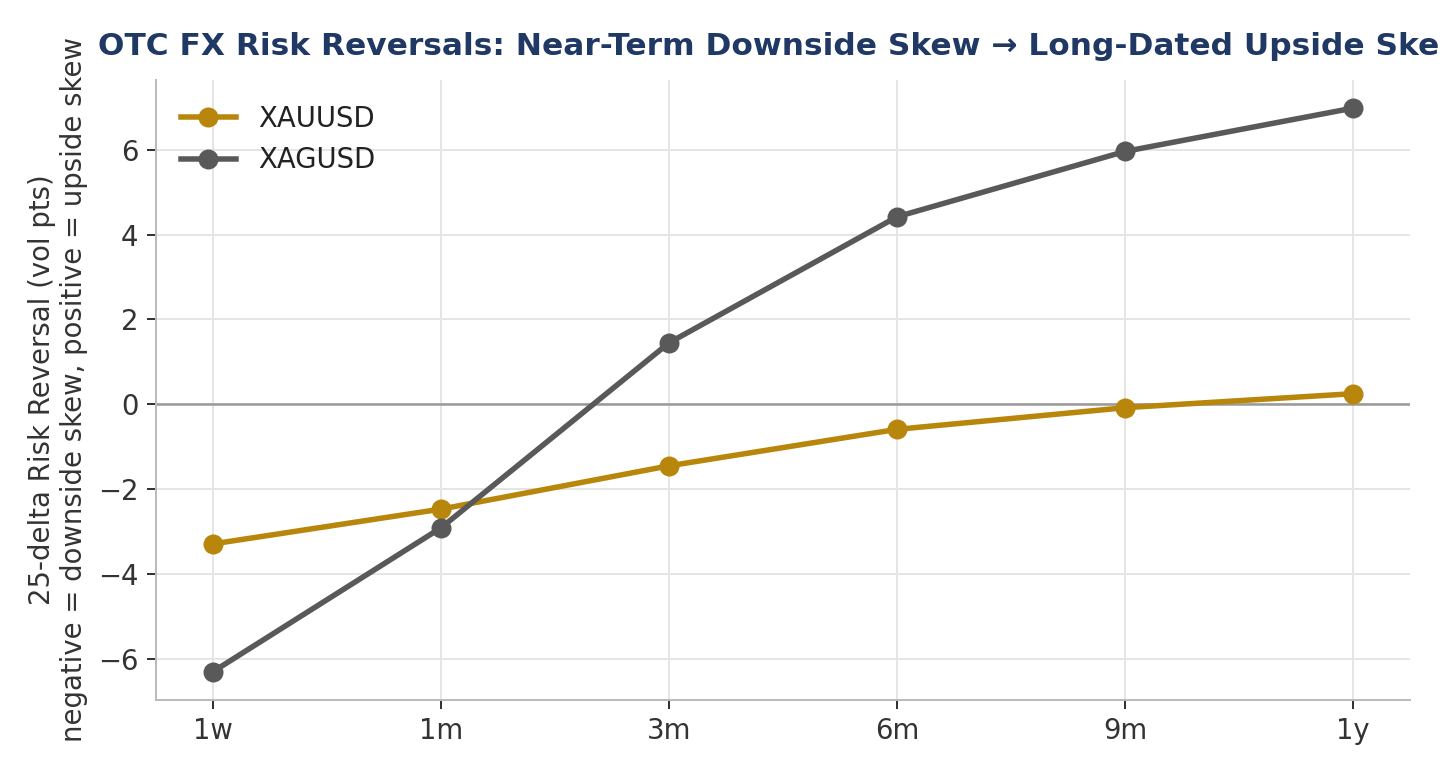
USDJPY risk reversal is negative at every tenor (−2.42 at 1 week, fading toward 0 at 1 year) — the market consistently pays for yen-strength/dollar-weakness protection even with spot near cycle highs (161.83), a tension worth tracking.
Rates, funding, and carry
US/Japan 2-year yield spread: 2.77% (10 Jul 2026), up from 2.72%, tracking USDJPY (161.70) higher together, near a multi-year extreme but via the standard carry mechanism, not a broken one.
USDJPY 3-month FX swap points: −119.02, near cycle-wide levels, cheap yen funding continues to support the carry trade and upward USDJPY pressure.
EUR/USD cross-currency basis (CME XEURBI index): +0.52 → −0.28 bp over 6 July–10 July, normal daily noise around zero. No sign of dollar funding stress (a genuine squeeze historically shows as a sharply negative, persistent basis, e.g. 2008 or March 2020).
US 5-year sovereign CDS: 38.20, +8.89% over the trailing year. Japan 5-year CDS: 27.12, +31.20% YoY — the largest 1-year move on the board outside clearly distressed names. Neither is alarming in absolute level, but both drifting wider over the same period is consistent with a slow-burn sovereign-credit repricing.
US M2 money supply: $22,804.5B (April 2026), an all-time high, up from $22,686.4B in March — roughly +4.6% over the trailing eleven months, a clear reacceleration after the 2022–23 contraction.
Central Bank Gold Buying (World Gold Council)
Source: World Gold Council Gold Demand Trends and the 2026 Central Bank Gold Reserves Survey
Structural acceleration
Pace has doubled: central banks have accumulated an average of ~1,000 tonnes/year over the past four years, versus a ~500 tonne/year average over the preceding decade.
Q1 2026 net purchases: 244 tonnes — above both the prior quarter and the five-year average, despite the Iran conflict’s onset during the quarter.
Sentiment at record highs: 89% of surveyed reserve managers expect global central bank gold holdings to keep rising over the next 12 months; a record 45% expect their own institution’s reserves to increase (only 1% expect a decline); 84% expect gold to hold a higher share of total reserves over the next five years.
Reserve currency shift: 74% of surveyed central banks expect lower US dollar holdings in global reserve portfolios over the next five years. Per ECB estimates cited in the survey commentary, gold reached ~27% of global official reserves at the end of 2025, surpassing US Treasuries (~22%) for the first time.
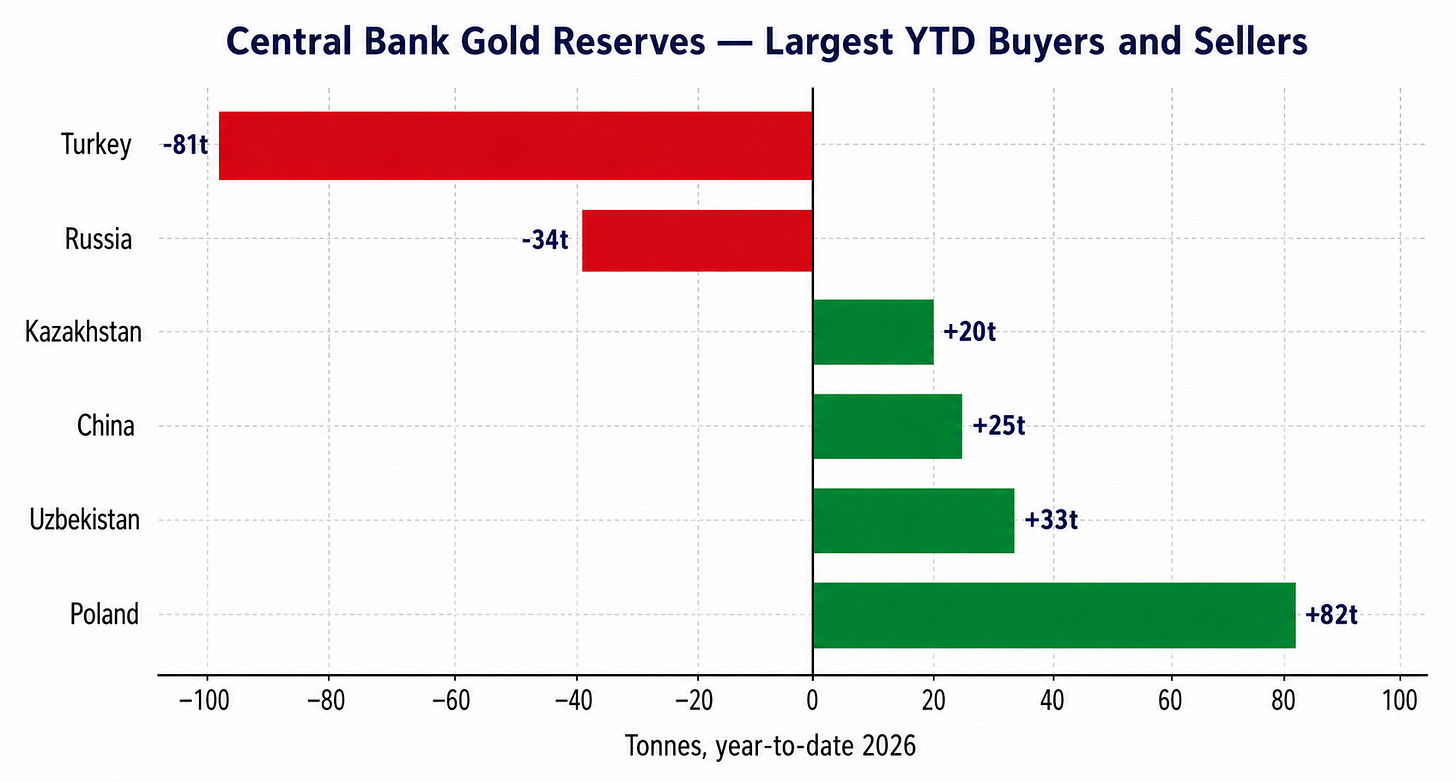
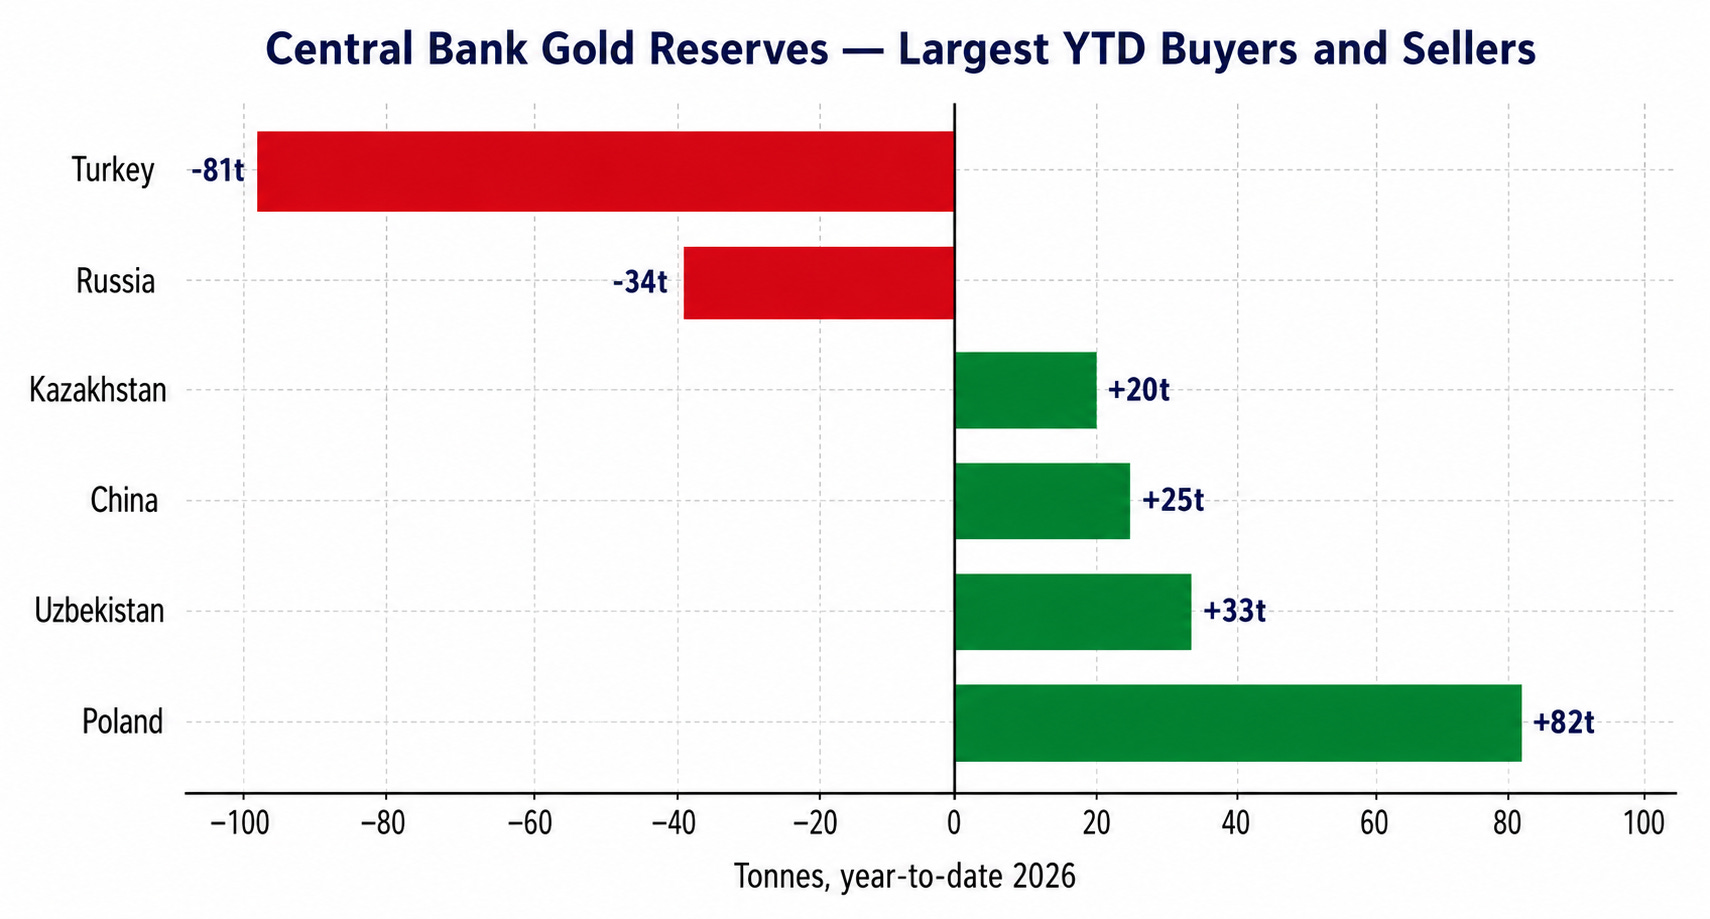
Turkey's gold sales were primarily a currency-defense operation triggered by the economic fallout from the Iran war and the disruption of the Strait of Hormuz, which pushed oil prices higher, increased Turkey's import bill and put significant pressure on the Turkish lira. Turkey sold or swapped gold to raise dollars and stabilize its currency rather than because of any negative view on gold itself.
How purchases are funded
50% of surveyed central banks fund gold acquisitions through domestic purchase programmes in local currency; 38% fund them by selling existing reserve assets (FX or other sovereign instruments).
The top ten sovereign holders account for roughly 70% of officially reported global gold reserves. Separately, the survey noted the Bank of England remains the most-used vaulting location (57% of respondents), though 9% of institutions increased domestic storage over the past year and a further 7% plan to in the next 12 months — a modest but real repatriation tilt.
China Restricts Retail Gold Trading — Key Takeaways
This is not a gold ban and not a ban on gold ownership. Physical gold, jewelry, coins, gold accumulation plans and gold ETFs remain unaffected.
China is only shutting down bank-intermediated retail leveraged and margin gold trading linked to the Shanghai Gold Exchange (SGE).
Retail investors must close leveraged positions or take delivery before 24 July 2026.
Chinese regulators want to avoid a repeat of the 2020 “Crude Oil Treasure” disaster, where retail investors suffered large losses when oil futures went negative.
Banks had already increased margin requirements to as high as 140%, effectively killing leverage economics before this final shutdown. The immediate impact is likely forced liquidation of leveraged longs, creating temporary downward pressure on gold prices. The long-term impact is a shift from retail speculation toward physical and institutional demand rather than a reduction in total Chinese gold demand.
Hong Kong Gold Clearing System Launch — Key Takeaways
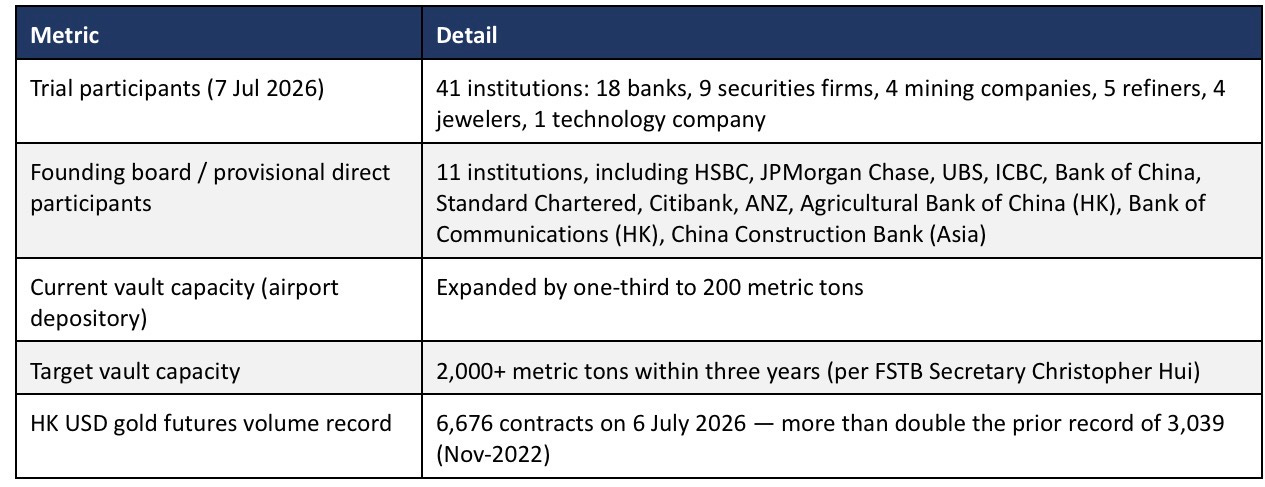
Hong Kong launched a government-owned gold clearing and settlement system on 7 July 2026 through the Hong Kong Precious Metals Central Clearing Company (HKPMCC).
The system uses London-style unallocated gold accounts, allowing large institutions to settle net positions without physically moving bars for every transaction.
Participants retain the ability to convert balances into physical delivery using London Good Delivery bars.
Hong Kong introduced a new gold benchmark price called HAU, designed to become the primary Asian-hours gold price reference.
The clearing system supports settlement in both US dollars and Chinese yuan, supporting China’s long-term RMB internationalization strategy.
The Shanghai Gold Exchange approved HKPMCC as an international member, creating the first direct physical and settlement connectivity between Hong Kong and Shanghai.
Major global banks including HSBC, JPMorgan, UBS, ICBC, Citi and Standard Chartered joined as founding participants.
Hong Kong aims to increase vault capacity from 200 tonnes today to over 2,000 tonnes within three years.
The strategic objective is to create a credible alternative to the London-New York gold clearing and price discovery system and increase China’s influence over global gold pricing.
How Monetary Reset may occur
Sovereign Balance Sheet Recapitalization
In the United States, for example, official gold reserves continue to be carried at $42.22 per ounce, a valuation established after the 1971 collapse of Bretton Woods. A formal revaluation of gold to a significantly higher price would immediately create trillions of dollars of reserve assets without requiring additional debt issuance or monetary expansion. This mechanism was used in 1934 when the Roosevelt administration raised the official gold price from $20.67 to $35 per ounce, effectively recapitalizing the banking system.
SDR Reform
Another possible pathway involves reform of the International Monetary Fund’s Special Drawing Rights (SDR) system. SDRs currently derive their value from a basket consisting of the US dollar, euro, Chinese yuan, Japanese yen and British pound. Some monetary reform proposals envision a future reserve framework where gold becomes part of the SDR basket alongside fiat currencies. Such a move would partially restore gold’s role as an official monetary anchor without requiring a full return to a gold standard.
Reserve Collateralization
In such a framework, gold would begin functioning less as a commodity and more as high-quality sovereign collateral similar to US Treasuries today. The greater the role of gold in global collateral markets, the higher its equilibrium value is likely to become.
FX Reserve Restructuring
The most visible and arguably most important mechanism currently underway is the restructuring of global foreign exchange reserves. The freezing of Russian foreign exchange reserves in 2022 fundamentally altered central bank thinking about reserve management and counterparty risk. Since then, central banks have accelerated gold purchases while gradually reducing their dependence on US Treasury securities and dollar-denominated assets. Gold offers a reserve asset that cannot be sanctioned, frozen or politically weaponized. Rather than occurring through a single dramatic event such as Bretton Woods, the next monetary reset may emerge slowly through years of reserve diversification, with gold steadily regaining a larger share of global reserve portfolios as confidence in the dollar-centric system gradually declines.
Conclusion
In simple terms, the market is hedging for a hawkish CPI today while quietly positioning for a monetary reset tomorrow.
Amazing research and analysis. Thanks.
It would be incredible if you were to do this same level of research for Bitcoin. Everyone seems to analyse Bitcoin with a bias. You seem to be able to analyse commodities with an unbiased perspective.
Bitcoin is a new-age commodity.